
Build a Powerful Observability Dashboard with Grafana, Prometheus, & Loki
Key Takeaways (TL;DR)
- Unified Monitoring Stack: This guide details how to build a single, powerful dashboard to monitor application metrics and logs using an open-source stack: Prometheus, Loki, and Grafana.
- Core Components: Learn how Prometheus collects numerical metrics, Loki aggregates structured logs, and Grafana provides a unified, visual interface for both.
- Simplified Deployment: The entire environment, including a sample application, can be deployed in minutes using a single Docker-Compose file provided in this tutorial.
- Actionable Insights: Master the basics of querying data with PromQL and LogQL, visualizing it in Grafana, and setting up alerts to proactively identify and resolve issues.
A centralized observability dashboard enables you to gain deep insights, troubleshoot issues faster, and manage system stability.
This article provides a complete walkthrough for setting up a comprehensive monitoring dashboard with:
- Prometheus,
- Loki,
- Grafana.

What Are the Three Pillars of Observability?
The three pillars of observability are metrics, logs, and traces.
A system is considered “observable” if you can fully understand its internal state by examining its external outputs.
While this guide focuses on metrics and logs, understanding all three is crucial for a complete observability strategy.
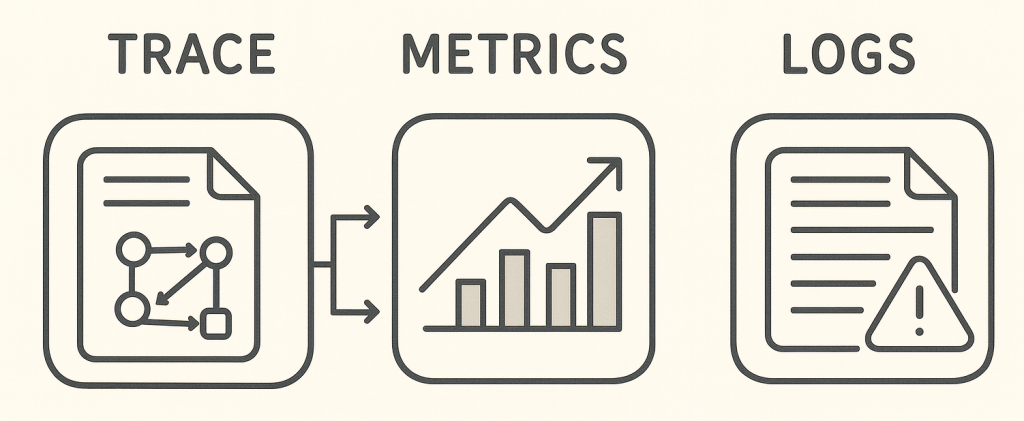
- Traces: A trace is a detailed record of a single request’s journey through all the microservices in your system, helping you pinpoint bottlenecks.
- Metrics: These are numerical, time-series data that tells you what is happening (e.g., CPU usage is at 90%).
- Logs: Logs are timestamped text records of specific events that tell you why something is happening (e.g., an error message showing the cause of a CPU spike).
What are Metrics? The Role of Prometheus
Metrics are numerical representations of data measured over time, such as CPU usage, memory consumption, or the number of HTTP requests per second. Prometheus is the open-source, industry-standard tool for collecting and storing these metrics. It operates by periodically pulling, or “scraping,” metrics from configured endpoints on your applications and services.
Key Prometheus Concepts
- Time-series Data: Prometheus stores all data as streams of timestamped values belonging to the same metric and set of labels.
- Exporters: It scrapes metrics from applications directly or via an intermediary agent called an “exporter” for systems that don’t natively expose Prometheus metrics (like databases or hardware).
- PromQL: A powerful and flexible query language (PromQL) lets you select, aggregate, and perform calculations on time-series data in real-time.
What Are Logs and Why Use Loki?
Logs are immutable, timestamped records of discrete events that occurred over time. While metrics tell you that something is wrong, logs often tell you why.
Loki is a log aggregation system designed by Grafana Labs to be highly cost-effective and easy to operate. It is inspired by Prometheus.
How Loki’s Architecture is Different
- No Full-Text Indexing: Loki only indexes a small set of metadata (labels) for each log stream, not the full text of the message. This makes it significantly cheaper to run and store data.
- Prometheus-style Labels: It uses the same labels as Prometheus (e.g.,
job,instance) to correlate logs with metrics, creating a seamless debugging experience. - LogQL: Its query language, LogQL, is inspired by PromQL. You use it to filter log streams by their labels and then optionally grep through the message content.
What is Grafana? Your Visualization Tool
Grafana is the open-source platform for analytics and monitoring. It allows you to query, visualize, alert on, and understand your data no matter where it’s stored.
Grafana is the interface that brings your metrics and logs together in one place.
What Are Grafana’s Key Strengths?
- Unified View: It can combine data from different sources (like Prometheus and Loki) into a single dashboard. You can have a panel showing metrics right next to a panel showing related logs.
- Rich Visualizations: It offers a wide array of panel types, from time-series graphs to tables and gauges, to build insightful dashboards.
- Data Source Plugins: Grafana connects directly to your data sources. It has native support for Prometheus, Loki, and dozens of other databases and services.
- Alerting: You can define alerts visually from your dashboard panels and get notified via channels like email, Slack, or PagerDuty.
How to Set Up the Monitoring Stack with Docker-Compose
We’ll use Docker-Compose to spin up our entire environment. This includes Prometheus, Loki, Grafana, an agent called Promtail to collect logs, and a sample application to monitor.
If you dont already have a Linux server ready with Docker, here are instructions on how to create one.
First, create a project directory and save the following file as docker-compose.yml.
YAML
services:
  prometheus:
    image: prom/prometheus:v2.53.0
    container_name: prometheus
    command:
      - '--config.file=/etc/prometheus/prometheus.yml'
    ports:
      - '9090:9090'
    volumes:
      - ./prometheus.yml:/etc/prometheus/prometheus.yml
    restart: unless-stopped

  loki:
    image: grafana/loki:3.1.0
    container_name: loki
    command: -config.file=/etc/loki/loki-config.yml
    ports:
      - '3100:3100'
    volumes:
      - ./loki-config.yml:/etc/loki/loki-config.yml
    restart: unless-stopped

  promtail:
    image: grafana/promtail:3.1.0
    container_name: promtail
    command: -config.file=/etc/promtail/promtail-config.yml
    volumes:
      - /var/lib/docker/containers:/var/lib/docker/containers:ro
      - /var/run/docker.sock:/var/run/docker.sock
      - ./promtail-config.yml:/etc/promtail/promtail-config.yml
    restart: unless-stopped

  grafana:
    image: grafana/grafana:11.1.0
    container_name: grafana
    ports:
      - '3000:3000'
    environment:
      - GF_SECURITY_ADMIN_PASSWORD=your_super_secret_password
    volumes:
      - grafana-data:/var/lib/grafana
    restart: unless-stopped

  # Our sample application
  app:
    image: prom/blackbox-exporter:v0.25.0 # Using blackbox exporter as a sample target
    container_name: app
    command: '--config.file=/etc/blackbox.yml'
    volumes:
      - ./blackbox.yml:/etc/blackbox.yml
    restart: unless-stopped

volumes:
  grafana-data:
Step 1: Configure Prometheus
Create a file named prometheus.yml. This file tells Prometheus which applications (targets) to scrape for metrics.
global:
  scrape_interval: 15s

scrape_configs:
  - job_name: 'prometheus'
    static_configs:
      - targets: ['localhost:9090']

  - job_name: 'app'
    static_configs:
      - targets: ['app:9115'] # The blackbox-exporter default port
Step 2: Configure Promtail to Ship Logs
Promtail is the agent that discovers running containers, collects their logs, and sends them to Loki.
Create promtail-config.yml in your project directory.
server:
  http_listen_port: 9080
  grpc_listen_port: 0

positions:
  filename: /tmp/positions.yaml

clients:
  - url: http://loki:3100/loki/api/v1/push

scrape_configs:
  - job_name: docker
    docker_sd_configs:
      - host: unix:///var/run/docker.sock
        refresh_interval: 5s
    relabel_configs:
      - source_labels: ['__meta_docker_container_name']
        regex: '/(.*)'
        target_label: 'container'
      - source_labels: ['__meta_docker_container_log_stream']
        target_label: 'stream'
      - source_labels: ['__meta_docker_container_label_logging_jobname']
        target_label: 'job'
Step 3: Create Placeholder Config Files
Docker requires all volume-mapped files to exist. Create these two minimal configuration files, loki-config.yml and blackbox.yml.
loki-config.yml:
auth_enabled: false

server:
  http_listen_port: 3100

ingester:
  lifecycler:
    address: 127.0.0.1
    ring:
      kvstore:
        store: inmemory
      replication_factor: 1
    final_sleep: 0s
  chunk_idle_period: 5m
  chunk_target_size: 1572864
  wal:
    enabled: true
    dir: /tmp/loki/wal

schema_config:
  configs:
    - from: 2020-10-24
      store: boltdb-shipper
      object_store: filesystem
      schema: v11
      index:
        prefix: index_
        period: 24h

storage_config:
  boltdb_shipper:
    active_index_directory: /tmp/loki/boltdb-shipper-active
    cache_location: /tmp/loki/boltdb-shipper-cache
    cache_ttl: 24h
  filesystem:
    directory: /tmp/loki/chunks

compactor:
  working_directory: /tmp/loki/compactor

limits_config:
allow_structured_metadata: falseblackbox.yml:
modules:
  http_2xx:
    prober: http
    timeout: 5s
    http:
      valid_status_codes: []
method: GETStep 4: Launch the Stack
Now, from your terminal in the project directory, run the following command to start all the services in the background.
docker compose up -d   #v2
# use docker-compose up -d if using V1
How to Build Your First Grafana Dashboard
Navigate to http://localhost:3000 in your browser. Log in with the username admin and the password you set in the docker-compose.yml file (your_super_secret_password).
Step 1: Connect Grafana to Data Sources
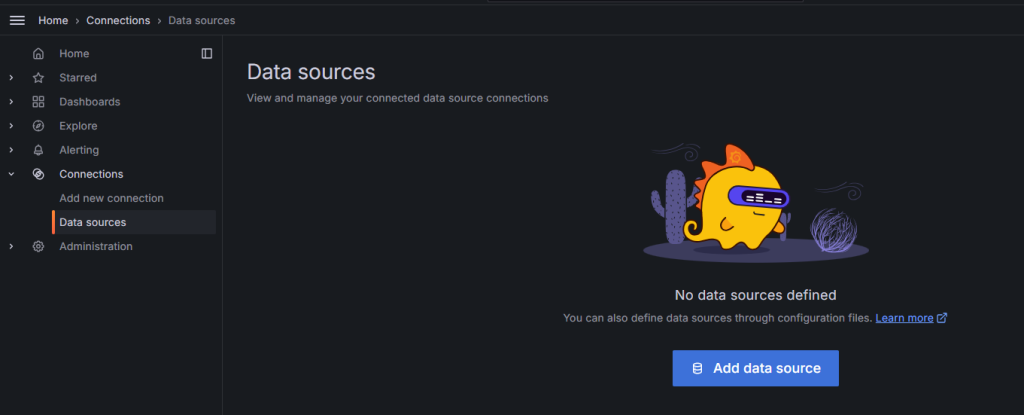
- Click the Connections on the left menu, then select Data Sources.
- Click Add data source and select Prometheus.
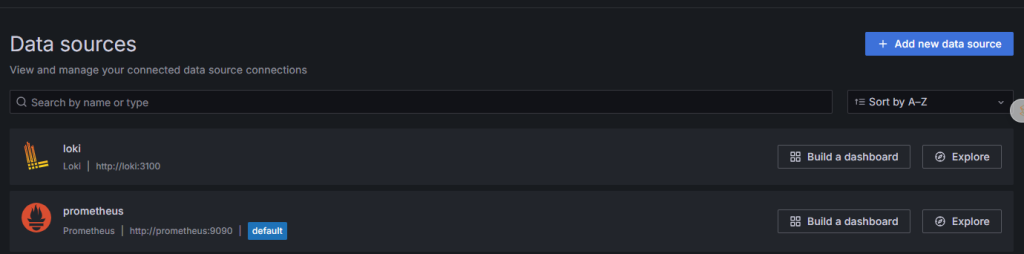
- Set the URL to
http://prometheus:9090and click Save & Test. - Go back, click Add data source again, and select Loki.
- Set the URL to
http://loki:3100and click Save & Test.
Step 2: Visualize Application Metrics
- Click the plus (+) icon on the left menu and select New Dashboard.
- Click Add Visualization
- Ensure the Prometheus data source is selected at the bottom.
- In the query editor, enter the PromQL query
up. This shows the health of your monitored jobs (1 for up, 0 for down). - On the right-hand side, choose the Stat visualization.
Let’s create another panel to track scrape duration. Use the query prometheus_target_scrape_pool_sync_seconds and select the Time series visualization.
Step 3: Explore Logs with Loki
- Click the compass icon (Explore) on the left menu.
- At the top-left, select the Loki data source.
- Click on Log browser and then the
containerlabel. You will see a list of your running containers. - Select the
appcontainer to see its logs. - To filter these logs, use a LogQL query like
{container="app"} |= "error"to find lines containing the word “error”.
To correlate metrics and logs, click the Split button at the top. In the new pane, select the Prometheus data source. Now you can view a metric graph and the corresponding logs from the same time period side-by-side.
How to Set Up Basic Alerting in Grafana
Grafana’s alerting allows you to be notified when a metric crosses a certain threshold.
Step 1: Create an Alert Rule
- In the left menu, go to the bell icon (Alerting) and select Alert rules.
- Click New alert rule.
- Name the rule (e.g., “Application instance down”).
- Set the data source to Prometheus and use the query
up{job="app"}. - Add a Reduce expression to get the last value of the time series.
- Add a Threshold expression to trigger when the value is below 1. This fires the alert if the job is down.
- Set an evaluation interval (e.g., evaluate every 1 minute for 5 minutes).
- Save the rule.
Step 2: Configure Notification Channels
- In the Alerting section, click on Contact points.
- Click New contact point, give it a name (e.g., “Admin Email”), and select an integration like Email.
- Enter the destination email address and save the contact point.
- Navigate to Notification policies to route your new alert rule to the contact point you just created.
Conclusion
Congratulations! You have successfully built a powerful, centralized observability platform. You deployed a full monitoring stack with Docker-Compose and built a unified dashboard to visualize metrics and logs.
This setup provides a robust foundation for monitoring any application. The ability to correlate metrics with logs in a single interface drastically reduces the time it takes to diagnose and resolve problems. From here, you can explore more advanced Grafana features or integrate distributed tracing with a tool like Jaeger or Grafana Tempo.
Frequently Asked Questions (FAQ)
Q1: What is the main difference between Prometheus and Loki?
A1: Prometheus collects and stores numerical time-series data (metrics), like CPU usage or request counts. Loki collects and indexes labels for text-based log messages (logs), like application errors or status updates.
Q2: Why is Loki considered more cost-effective than other log systems?
A2: Loki does not index the full text of the log messages. It only indexes a small set of labels associated with each log stream, which significantly reduces storage costs and resource usage.
Q3: What is the purpose of Promtail?
A3: Promtail is the agent that runs alongside your applications. It discovers log sources (like Docker container logs), attaches labels, and pushes them to the central Loki instance for storage.
Q4: Can Grafana connect to data sources other than Prometheus and Loki?
A4: Yes. Grafana has a powerful plugin architecture and supports dozens of data sources out-of-the-box, including SQL databases (MySQL, PostgreSQL), NoSQL databases (Elasticsearch, InfluxDB), and cloud services.
Q5: What is the difference between PromQL and LogQL?
A5: PromQL (Prometheus Query Language) is used to select and aggregate time-series metric data. LogQL (Log Query Language) is used to select log streams based on their labels and then filter the text content of those logs.
Q6: Do I need a real application to follow this tutorial?
A6: No. This guide uses the blackbox-exporter Docker image as a stand-in for a real application. It provides a sample /metrics endpoint for Prometheus to scrape, making the setup self-contained.

Recent Comments