

Note: Tested and Validated Procedure on 15th December 2025
A Grafana TIG stack is a technology stack that stands for Telegraf, InfluxDB, and Grafana. It is commonly used for monitoring and visualizing time-series data in real time.
Need help setting up SSL? Check out our Grafana SSL (HTTPS) procedure.
Telegraf is an open-source data collection agent that collects and sends metrics and events to InfluxDB. InfluxDB is a time-series database that stores and manages the data collected by Telegraf. Grafana is a data visualization and monitoring platform that connects to InfluxDB to provide real-time visualizations and dashboards for the collected data.
Together, these three components create a powerful real-time platform for monitoring and visualizing time-series data. The TIG stack is particularly popular in DevOps and IT operations teams as it allows for monitoring various infrastructure components and application performance metrics.
In this demo, I will install the Grafana server on Ubuntu. Specifically, this will be a TIG stack. You will learn how to Set Up Grafana Monitoring Dashboards with Telegraf and InfluxDB Backend.
TL;DR
- Install Grafana, InfluxDB, and Telegraf from their official package repositories.
- Create an InfluxDB bucket and token before pointing Telegraf at the database.
- Add InfluxDB as a Grafana data source, then import or build dashboards.
- Secure Grafana with HTTPS once the TIG stack is working end to end.
Source check – May 10, 2026: Grafana, InfluxDB, and Telegraf still publish Ubuntu/Debian package-install paths in their official documentation. This guide keeps the install flow practical, but the repository commands should always be checked against the current vendor pages before production use.
| Topic | When | Command |
|---|---|---|
| Update base OS | Before installing packages | sudo apt update |
| Check InfluxDB CLI | After installing InfluxDB | influx --help |
| Validate Telegraf | Before enabling service | telegraf --test |
Start here: Build the stack in order – Grafana, then InfluxDB, then Telegraf – and only troubleshoot dashboards after Telegraf is successfully writing metrics into the bucket.
How to Install a TIG Stack

Ensure that you have a Linux Ubuntu 22.04 server available.
Step 1 – Update Ubuntu Base System
Type the following to update the base repos
apt update -yNow prep the server to install all the required software
apt install gnupg2 software-properties-common -yStep 2 – Install Grafana
Important: Grafana will change the GPG keys on occasion. There is nothing I can do about that. You will need to check the latest keys if you get an error on this section in the future (Added December 23)
sudo apt-get install -y apt-transport-https software-properties-common wget
sudo mkdir -p /etc/apt/keyrings/
wget -q -O - https://apt.grafana.com/gpg.key | gpg --dearmor | sudo tee /etc/apt/keyrings/grafana.gpg > /dev/null
echo "deb [signed-by=/etc/apt/keyrings/grafana.gpg] https://apt.grafana.com stable main" | sudo tee /etc/apt/sources.list.d/grafana.listNow update your repo’s
apt update -yYou will notice that APT is now looking at the Grafana repo
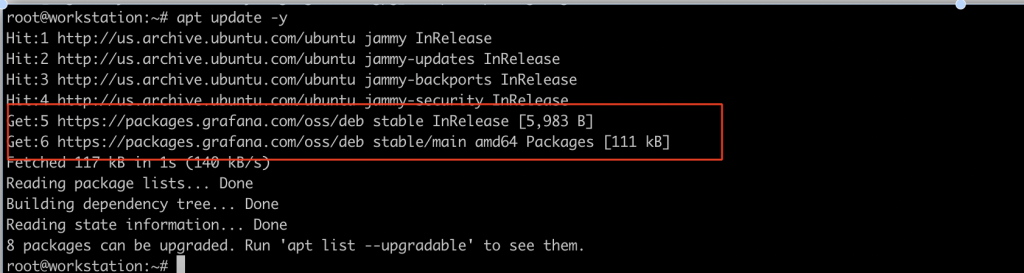
apt install grafana -y
systemctl start grafana-server
systemctl enable grafana-serverYou can check the status of the Grafana service using
systemctl status grafana-serversystemctl status grafana-server
● grafana-server.service - Grafana instance
Loaded: loaded (/lib/systemd/system/grafana-server.service; enabled; vendor preset:>
Active: active (running) since Sun 2023-12-17 07:23:59 UTC; 28s ago
Docs: http://docs.grafana.org
Main PID: 2826 (grafana)
Tasks: 9 (limit: 4579)
Memory: 90.5M
CPU: 6.194s
CGroup: /system.slice/grafana-server.service
└─2826 /usr/share/grafana/bin/grafana server --config=/etc/grafana/grafana.>
Dec 17 07:24:07 TIGv2 grafana[2826]: logger=ngalert.multiorg.alertmanager t=2023-12-17T0>
Dec 17 07:24:07 TIGv2 grafana[2826]: logger=sqlstore.transactions t=2023-12-17T07:24:07.>
Dec 17 07:24:07 TIGv2 grafana[2826]: logger=ngalert.migration t=2023-12-17T07:24:07.7900>
Dec 17 07:24:07 TIGv2 grafana[2826]: logger=ngalert.migration t=2023-12-17T07:24:07.7911>
Dec 17 07:24:07 TIGv2 grafana[2826]: logger=ngalert.migration orgID=1 t=2023-12-17T07:24>
Dec 17 07:24:07 TIGv2 grafana[2826]: logger=ngalert.migration orgID=1 t=2023-12-17T07:24>
Dec 17 07:24:07 TIGv2 grafana[2826]: logger=ngalert.migration orgID=1 t=2023-12-17T07:24>
Dec 17 07:24:07 TIGv2 grafana[2826]: logger=ngalert.migration t=2023-12-17T07:24:07.7962>
Dec 17 07:24:07 TIGv2 grafana[2826]: logger=grafana.update.checker t=2023-12-17T07:24:07>
Dec 17 07:24:07 TIGv2 grafana[2826]: logger=plugins.update.checker t=2023-12-17T07:24:07>
root@TIGv2:~Step 3a – Install InfluxDB
There have been lots of changes recently in InfluxDB. This includes lots of changes in the terminology used by Influx. For Example, databases are now called buckets.
Now add the influxDB repository to the Ubuntu server. This repo is not available by default and must be added manually.
Important: InfluxDB will change the GPG keys on occasion. There is nothing I can do about that. You will need to check the latest keys if you get an error on this section in the future (December 23)
wget -q https://repos.influxdata.com/influxdata-archive_compat.key
echo '393e8779c89ac8d958f81f942f9ad7fb82a25e133faddaf92e15b16e6ac9ce4c influxdata-archive_compat.key' | sha256sum -c && cat influxdata-archive_compat.key | gpg --dearmor | sudo tee /etc/apt/trusted.gpg.d/influxdata-archive_compat.gpg > /dev/null
echo 'deb [signed-by=/etc/apt/trusted.gpg.d/influxdata-archive_compat.gpg] https://repos.influxdata.com/debian stable main' | sudo tee /etc/apt/sources.list.d/influxdata.list

sudo apt-get update && sudo apt-get install influxdb2Now start and enable InfluxDB
systemctl enable --now influxdb
systemctl start influxdbYou can check the status of the InfluxDB service using
systemctl status influxdbYou should see output like this:
systemctl status influxdb
● influxdb.service - InfluxDB is an open-source, distributed, time series database
     Loaded: loaded (/lib/systemd/system/influxdb.service; enabled; vendor preset: enabled)
     Active: active (running) since Fri 2023-12-15 09:28:37 UTC; 4min 9s ago
       Docs: https://docs.influxdata.com/influxdb/
   Main PID: 660 (influxd)
      Tasks: 7 (limit: 4561)
     Memory: 117.6M
        CPU: 838ms
     CGroup: /system.slice/influxdb.service
             └─660 /usr/bin/influxd

Dec 15 09:28:36 TIG influxd-systemd-start.sh[660]: ts=2023-12-15T09:28:36.618476Z lvl=info msg="Open>
Dec 15 09:28:36 TIG influxd-systemd-start.sh[660]: ts=2023-12-15T09:28:36.618822Z lvl=info msg="Open>
Dec 15 09:28:36 TIG influxd-systemd-start.sh[660]: ts=2023-12-15T09:28:36.619353Z lvl=info msg="Star>
Dec 15 09:28:36 TIG influxd-systemd-start.sh[660]: ts=2023-12-15T09:28:36.619624Z lvl=info msg="Star>
Dec 15 09:28:36 TIG influxd-systemd-start.sh[660]: ts=2023-12-15T09:28:36.626662Z lvl=info msg="Star>
Dec 15 09:28:36 TIG influxd-systemd-start.sh[660]: ts=2023-12-15T09:28:36.635822Z lvl=info msg="Conf>
Dec 15 09:28:36 TIG influxd-systemd-start.sh[660]: ts=2023-12-15T09:28:36.655351Z lvl=info msg=Liste>
Dec 15 09:28:36 TIG influxd-systemd-start.sh[660]: ts=2023-12-15T09:28:36.655770Z lvl=info msg=Start>
Dec 15 09:28:37 TIG influxd-systemd-start.sh[627]: InfluxDB started
Dec 15 09:28:37 TIG systemd[1]: Started InfluxDB is an open-source, distributed, time series databas>Step 3b – Configure InfluxDB via Localhost:8086
Browse to your InfluxDB installation using a web browser. Point it to the URL of your server on port: 8086

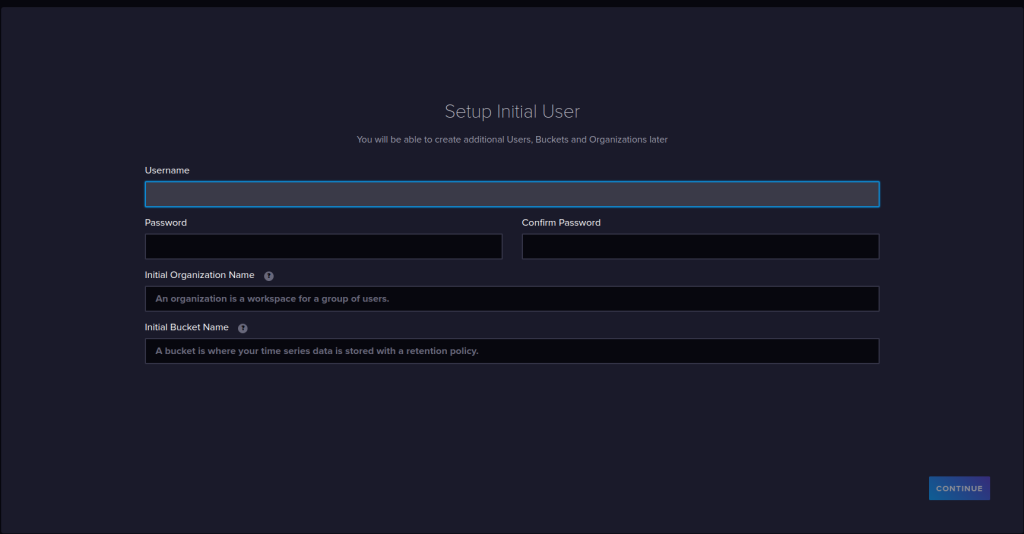
Hit the Get Started Button, then complete the initial setup processes:
You will need to provide:
- Username
- Password
- Organization
- Initial Bucket Name (your Database) – in this example, I will call mine telegraf
Upon Completion, you will get your API Key
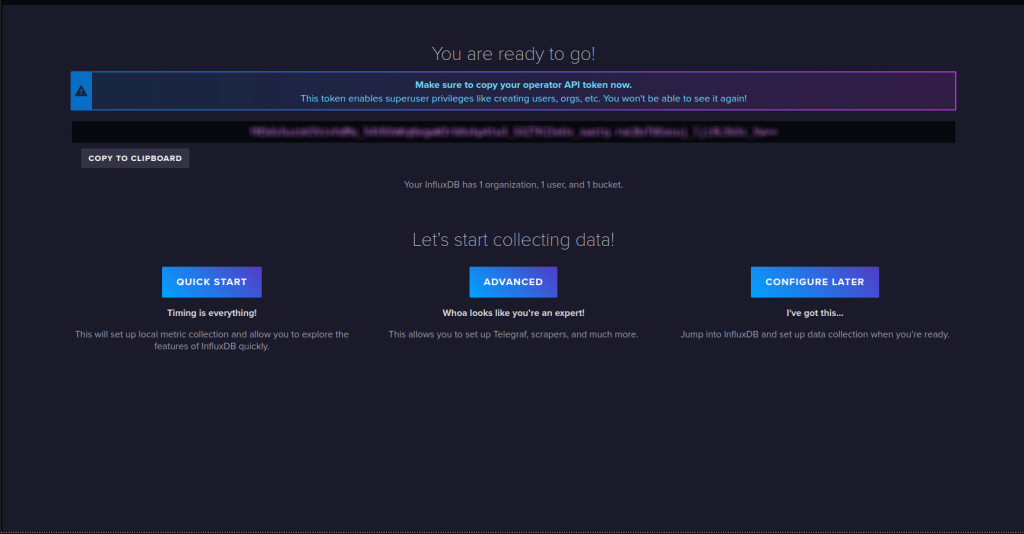
Important: Make a note of your API key because you will not see it again
Now that you have your API key, you can directly query the DB. From the CLI, type
OPTIONAL: Step 3c – Configure the InfluxCLI
Skip to Step 4 if you want to keep the installation as simple as possible
Download the Influx CLI
wget https://dl.influxdata.com/influxdb/releases/influxdb2-client-2.7.3-linux-amd64.tar.gzUnpack the Influx CLI#
tar xvzf ./influxdb2-client-2.7.3-linux-amd64.tar.gzAdd the InfluxCLI to your $path
sudo cp ./influx /usr/local/bin/Important, you must configure the CLI to work with the API token created earlier
influx config create --config-name INFLUXDB \
  --host-url http://my-ip-address:8086 \
  --org ORG \
  --token 123456789012345678901234567890 \
--activeNow create a database for Telegraf
Step 4 – Install Telegraf
This one-liner will install the SHA256-verified version of Telegraf
sudo apt-get install telegraf -yCreate a default telegraf config from the InfluxDB UI
From the InfluxDB UI., select the top tab and choose Telgraf.
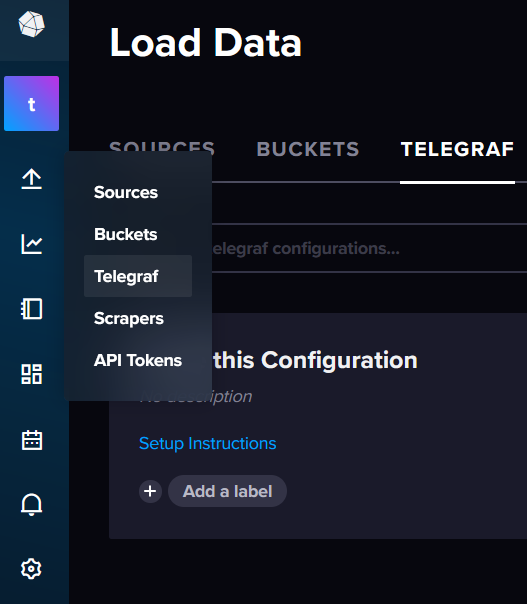
Now select Telegraf Internal
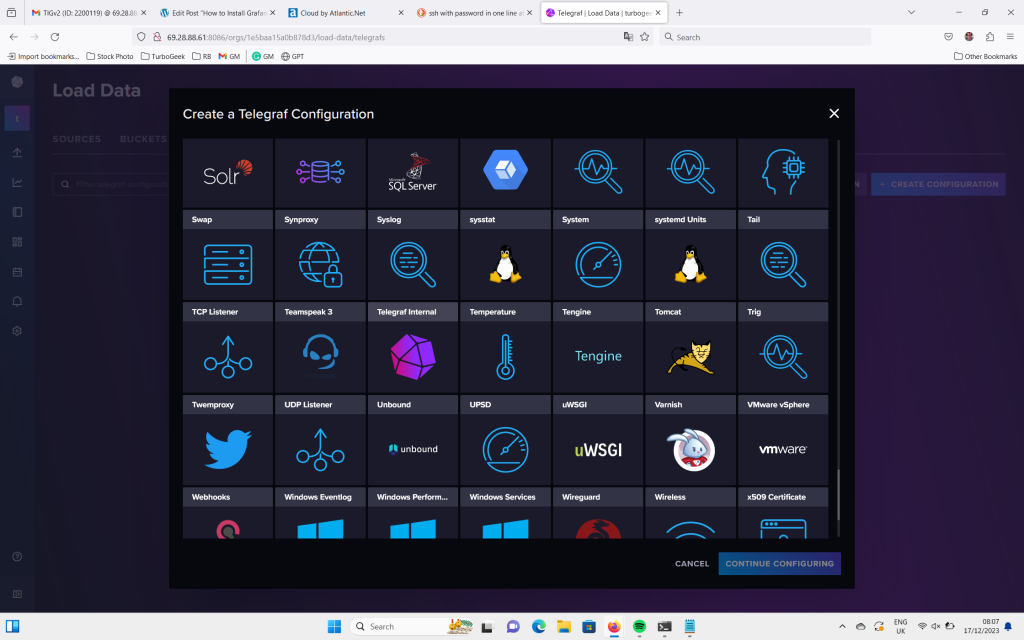
Upon completion, you will be given an API key and an init command
First, Export your API key to the shell
export INFLUX_TOKEN=12345678901234567890123456789012345678901234567890123456789012345678901234567890Now init your Telegraf installation
telegraf --config http://my_ip_address:8086/api/v2/telegrafs/0c49b4ae6142f000Step 5 – Setup Grafana Data Source
Next, you will need to access the Grafana dashboard and add a data source to display the InfluxDB and Telegraf metrics.
You can access the Grafana dashboard at http://your-server-ip:3000/. You should see the Grafana login page:
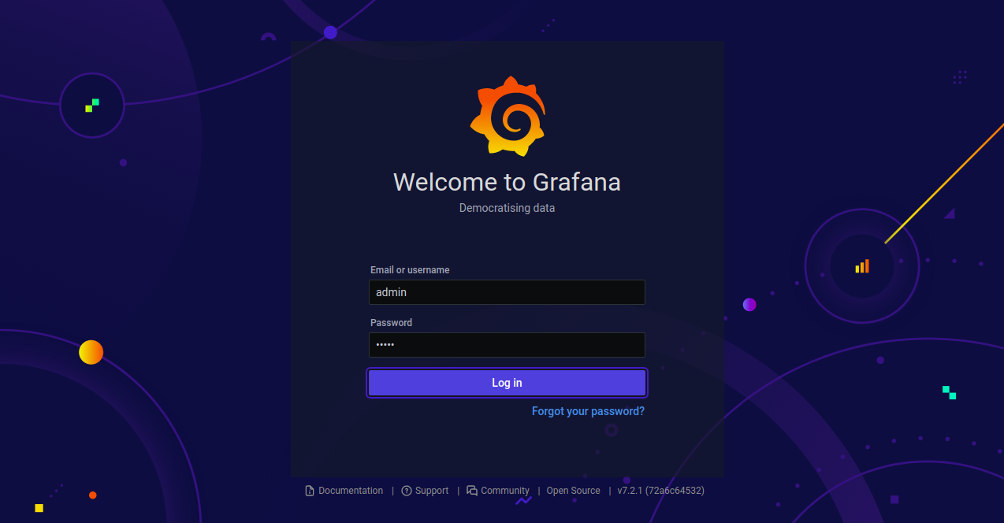
Provide default username as admin and password as admin then click on the login button. You should see the password reset screen:
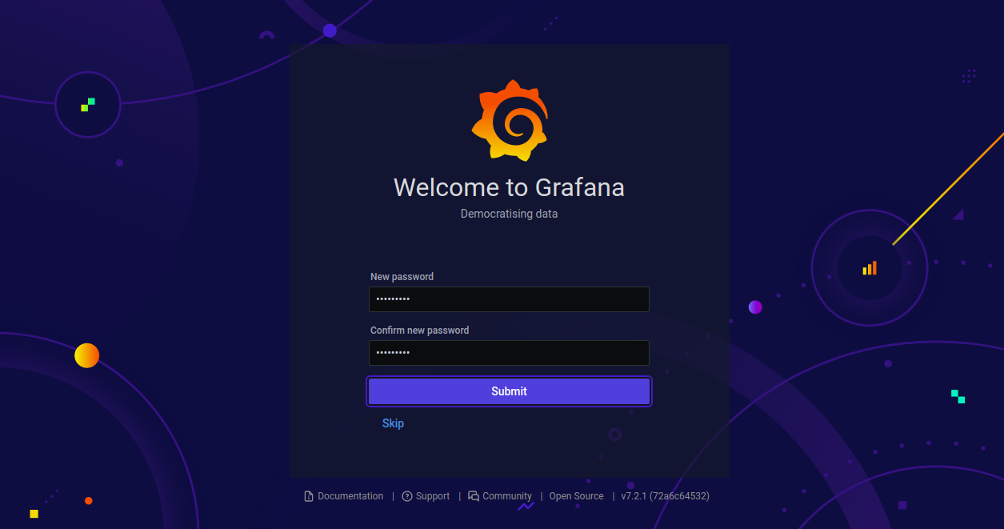
Note: Since Grafana version 7.2.2, many users have reported the default admin and password does not work. If this is the case, type the following on your server command prompt:
grafana-cli admin reset-admin-password mynewpasswordAdd your new password and click the Submit button to change the default password. You should see the Grafana dashboard on the following page:
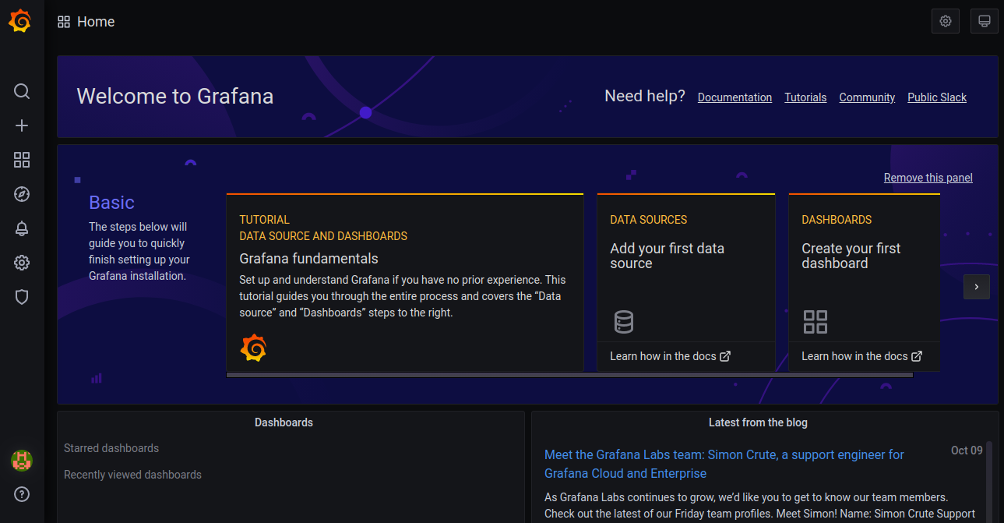
To add the data source, click on Add your first data source. You should see the following screen:
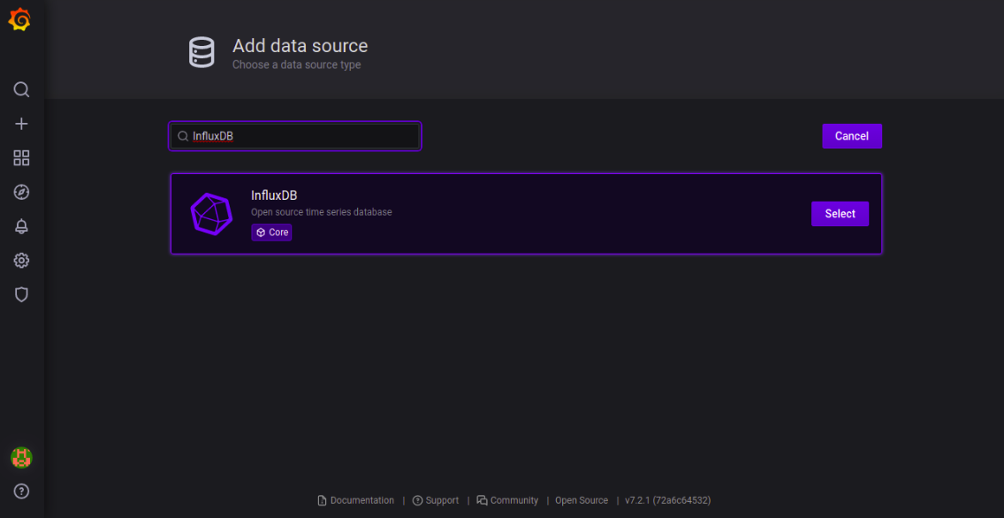
Search for InfluxDB and click on the Select button. You should see the following page:
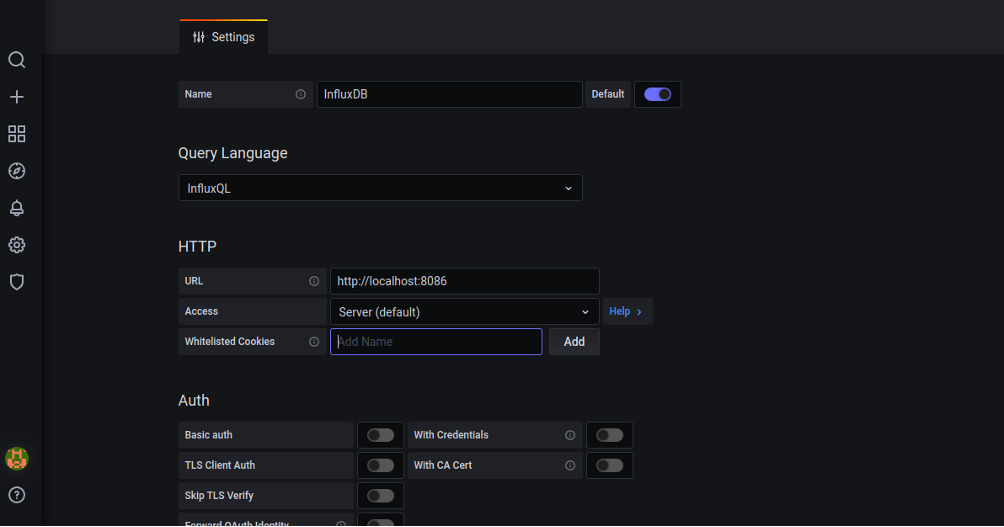
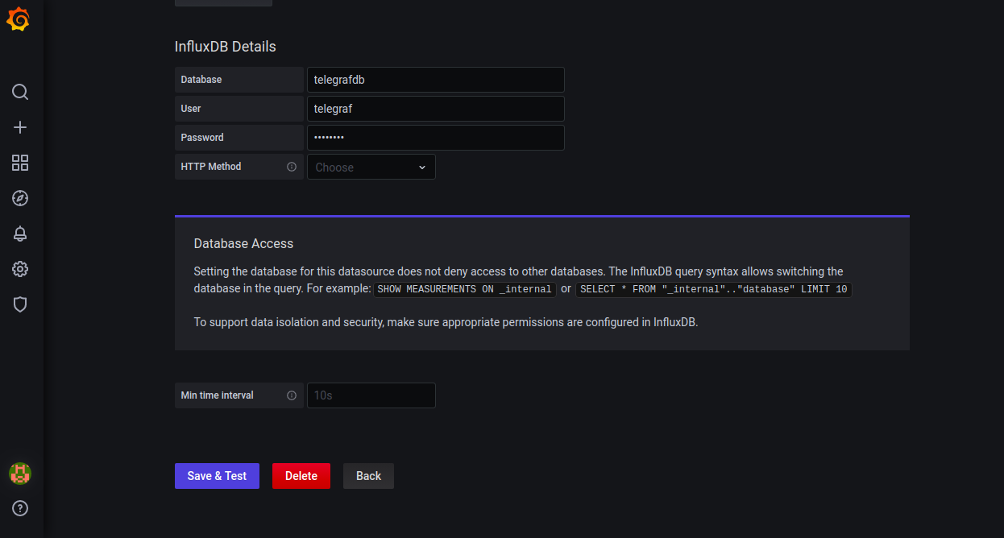
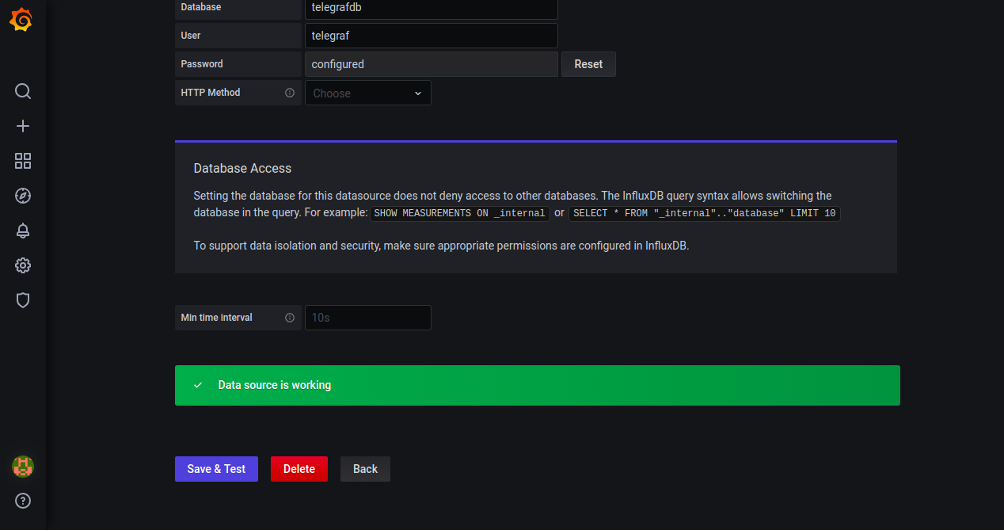
Set the name of the InfluxDB, select FLUX in Query Language, define the URL of the InfluxDB data source, provide InfluxDB database details, and click on the Save & Test button. Once the test is successful, you should see the following page:
Step 6 – Setup Grafana Dashboard
At this point, we have added InfluxDB as a data source to the Grafana server. Next, you will need to import the Grafana dashboard.
On the Grafana Dashboard, click on the ‘+’ menu on the left panel and click the ‘Import‘ button. You should see the following page:
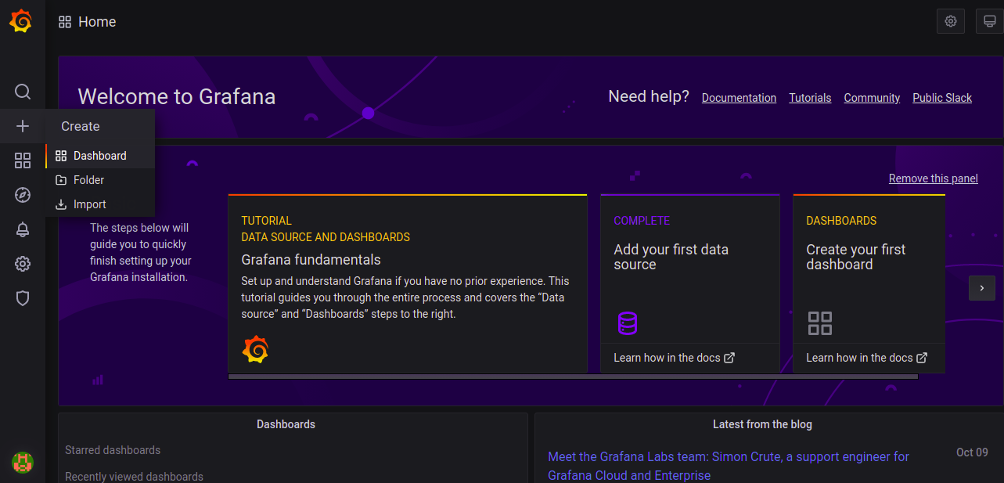
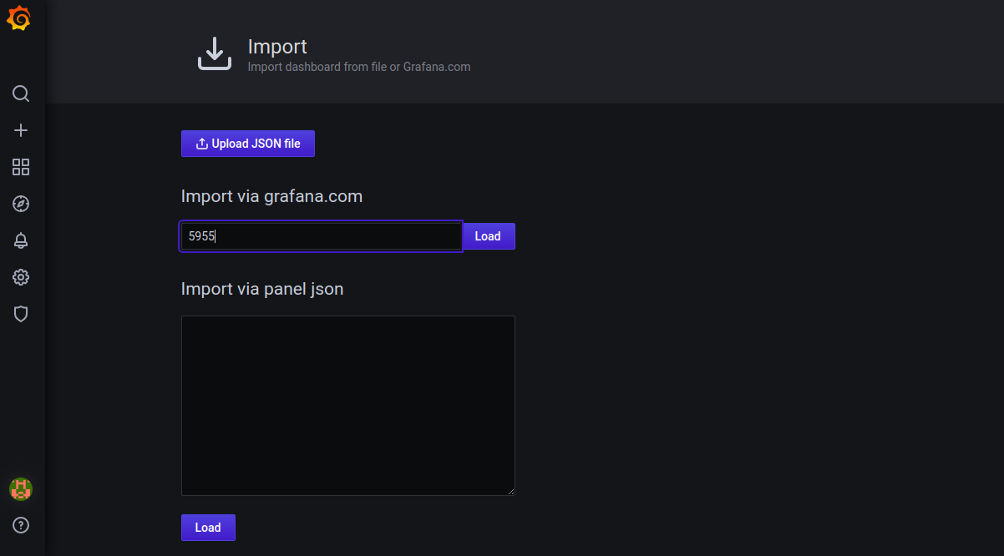
Type Grafana ID 5955 and click on the Load button to load the dashboard as shown below.
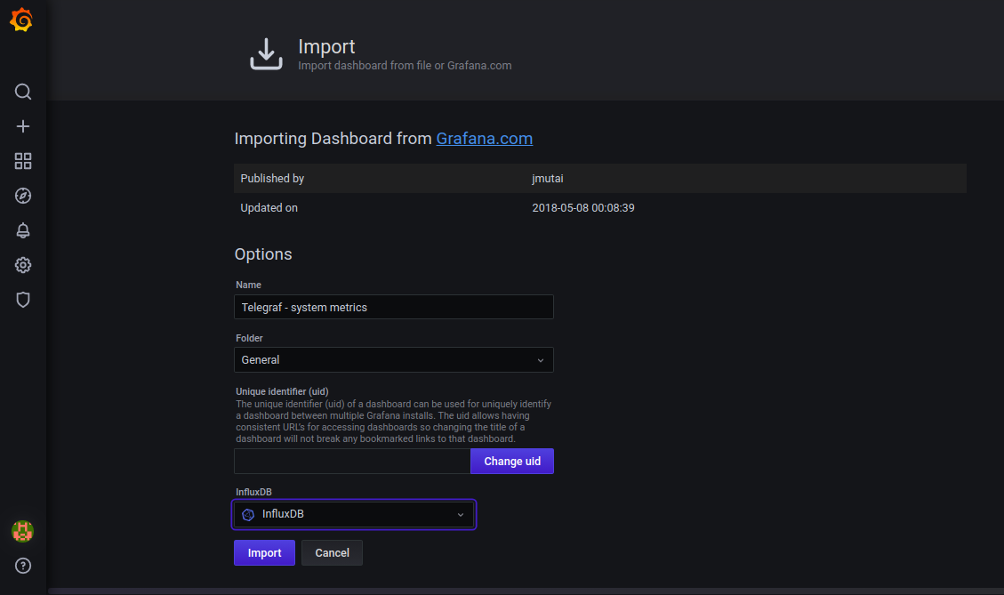
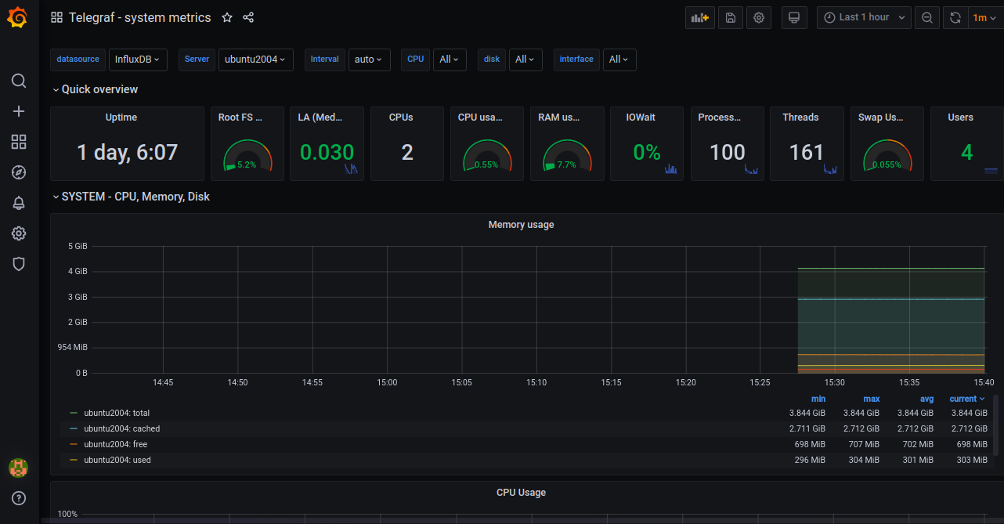
Select InfluxDB and click on the Import button. You should see the Grafana Dashboard showing the system metrics collected by the Telegraf agent:
The power of a TIG Stack: Monitor Your Data Sources with Ease
The Grafana TIG stack is one of the most popular and powerful open-source tools available for monitoring a wide panel of data sources. This stack includes Telegraf, InfluxDB, and Grafana and can help streamline your data collection, aggregation, and reporting processes.
What is Telegraf?
Telegraf is a server agent used for collecting and aggregating data and reporting metrics. It is a highly scalable application that allows users to easily access metrics from the system. With Telegraf, you can monitor, store, and analyze data from any source in any format.
What is InfluxDB?
InfluxDB is an open-source database that stores data and exposes it to the Grafana dashboard. It can automate sensors and devices in real-time and provide insights into the performance of your systems and applications. With InfluxDB, you can quickly and easily access and monitor your data sources, ensuring that you have the data you need to make informed decisions.
What is Grafana?
Grafana is an open-source data visualization tool that supports various time series data stores, including Prometheus, Elasticsearch, and InfluxDB. It helps create beautiful, interactive dashboards for easy data exploration and troubleshooting. With Grafana, you can quickly and easily visualize your data sources in real-time.
You can easily monitor your data sources by leveraging the powerful Grafana TIG stack. With Telegraf, Grafana, and InfluxDB, you can quickly and easily collect, aggregate, and analyze data from any source. With the TIG stack, you can be confident that your data is secure, accurate, and up-to-date.
Leave a Reply