How to Install and Use Glances on RHEL 9/8, Rocky Linux, & AlmaLinux (2026 Guide)
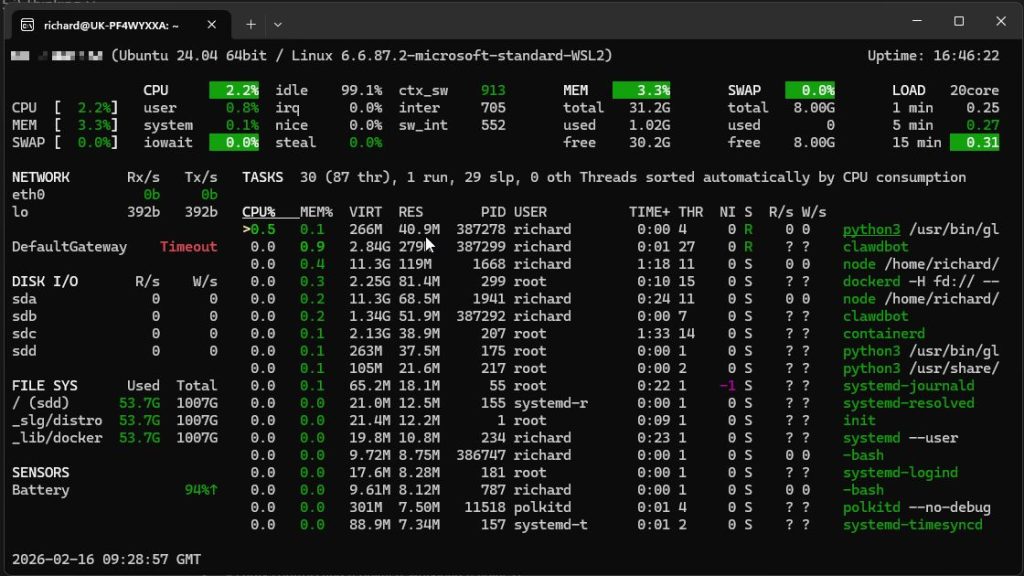
Glances is a Python-based system monitoring tool that provides a real-time, comprehensive view of server performance. Unlike basic tools like top, Glances monitors CPU, memory, load, disk I/O, network interfaces, and hardware sensors in a single interface. It supports local terminal monitoring, a web-based UI, and client-server modes.
For RHEL 9 and 8 (including Rocky Linux and AlmaLinux), the most efficient installation method is via the EPEL repository using the DNF package manager. This ensures all dependencies, including Python libraries, are managed automatically by the system

Glances vs. Standard Tools
| Feature | Top | Htop | Glances |
| Primary View | Processes | Processes + Bar Graphs | Full System Dashboard |
| Disk I/O | No | Limited | Yes (Detailed) |
| Network I/O | No | No | Yes |
| Web Interface | No | No | Yes (Built-in) |
| Alerting | No | No | Yes (Color-coded) |
| Export Formats | No | No | CSV, JSON, InfluxDB |
Why Use Glances for Server Monitoring?
Glances consolidates critical metrics into a scannable dashboard, making it an essential tool for 2026 system administration.
- Unified Dashboard: View CPU, Load, Memory, Swap, Network, and Disk I/O without switching tools.
- Visual Alerts: Uses green (OK), blue (Careful), violet (Warning), and red (Critical) to signal resource exhaustion.
- Zero-Configuration Web UI: Launch a web server to monitor your RHEL instance from any browser.
- Docker Integration: Automatically detects and monitors container resource usage.
Method 1: Install Glances with DNF (Recommended)
Using the Extra Packages for Enterprise Linux (EPEL) repository is the most stable path for RHEL-based systems.
Step 1: Enable the EPEL Repository
Install the release package for your specific OS version to gain access to the Glances package.
For RHEL 9, Rocky Linux 9, or AlmaLinux 9:
sudo dnf install https://dl.fedoraproject.org/pub/epel/epel-release-latest-9.noarch.rpm -yFor RHEL 8, Rocky Linux 8, or AlmaLinux 8:
sudo dnf install https://dl.fedoraproject.org/pub/epel/epel-release-latest-8.noarch.rpm -yStep 2: Install the Package
Once the repository is active, run the installation command:
sudo dnf install glances -yMethod 2: Install Glances with Pip
Use this method if you require a specific version or are working in a Python virtual environment.
Step 1: Install Python and Pip
Ensure the Python environment is ready:
sudo dnf install python3 python3-pip -yStep 2: Install Glances via PyPI
Install Glances along with the bottle library to enable web interface functionality:
sudo pip3 install glances[all]How to Start and Navigate Glances
Launch the interface directly from your terminal to begin monitoring.
Local Terminal Monitoring
Execute the command:
glancesEssential Keyboard Shortcuts:
- m: Sort processes by Memory usage
- p: Sort processes by CPU usage
- c: Sort processes by CPU consumption
- d: Show/hide Disk I/O stats
- n: Show/hide Network stats
- q: Quit Glances
Remote Monitoring (Web Interface)
Glances includes a built-in web server. This allows you to view performance data via a browser.
- Start the Web Server:
glances -w & - Configure the Firewall: Open the default port (61208) to allow external traffic.
sudo firewall-cmd --add-port=61208/tcp --permanent sudo firewall-cmd --reload - Access the Dashboard: Navigate to
http://<your_server_ip>:61208in your browser.
Is your distribution outdated?
Installation on RHEL 7 or older is no longer supported. These versions are End-of-Life (EOL) and present significant security risks. We recommend migrating to RHEL 9 or a compatible derivative like Rocky Linux 9 to maintain security patches and software compatibility.
FAQ
How do I run Glances in the background?
You can run Glances as a service or use a terminal multiplexer like tmux. To run the web server in the background, use glances -w &.
What is the default port for Glances?
Glances uses port 61208 for its web interface and API. Ensure this port is open in firewalld or your cloud security groups.
Does Glances support Docker monitoring?
Yes. If Docker is running on your system, Glances will automatically display a list of active containers and their resource consumption.
Can I export Glances data?
Glances supports exporting data to various formats and databases, including CSV, InfluxDB, Prometheus, and Elasticsearch using the --export flag.
Why is Glances using high CPU?
If your system has thousands of processes, Glances may consume more CPU to refresh the list. You can increase the refresh interval using glances -t <seconds> (e.g., glances -t 5).


Recent Comments