Archive
Author: Richard Bailey
-

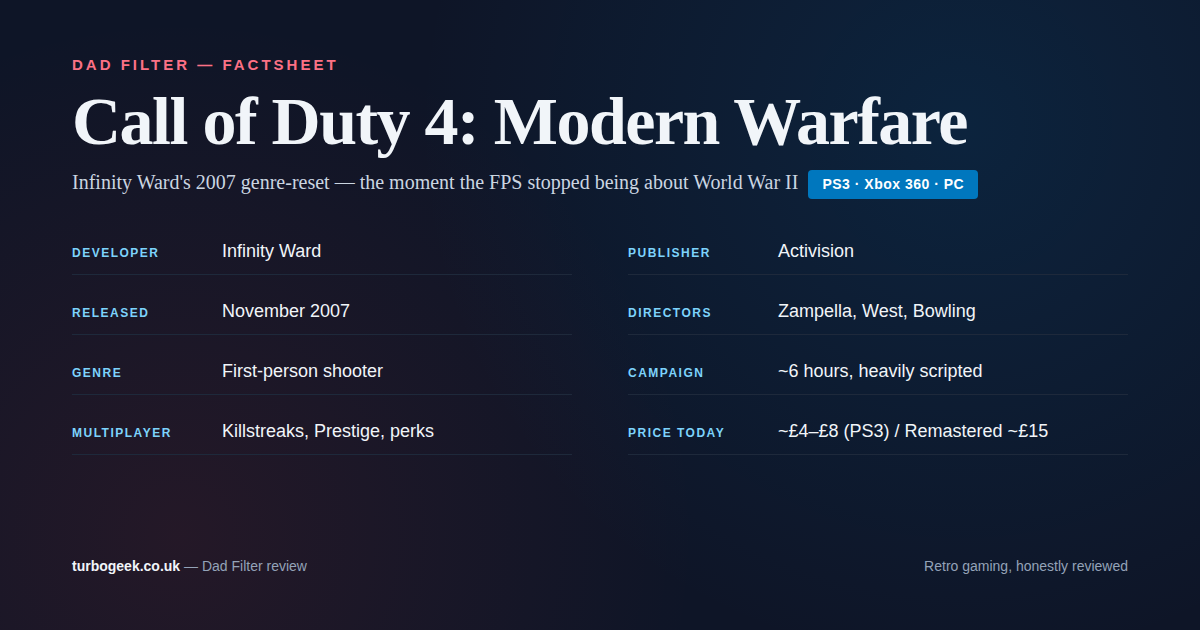
Call of Duty 4: Modern Warfare on PS3 (2007): A Dad’s Return to the Reset
Revisiting Infinity Ward’s 2007 Call of Duty 4 on PS3. The campaign that reset the entire FPS genre, still a masterclass in scripted setpiece design. Read the guide
-
The Agentic AI Operations Guide: Identity, Access, and Governance
AI agents are no longer experimental curiosities. In 2026, autonomous AI agents are writing code, deploying infrastructure, managing databases, and interacting with production systems via tool protocols such… Read the guide
-
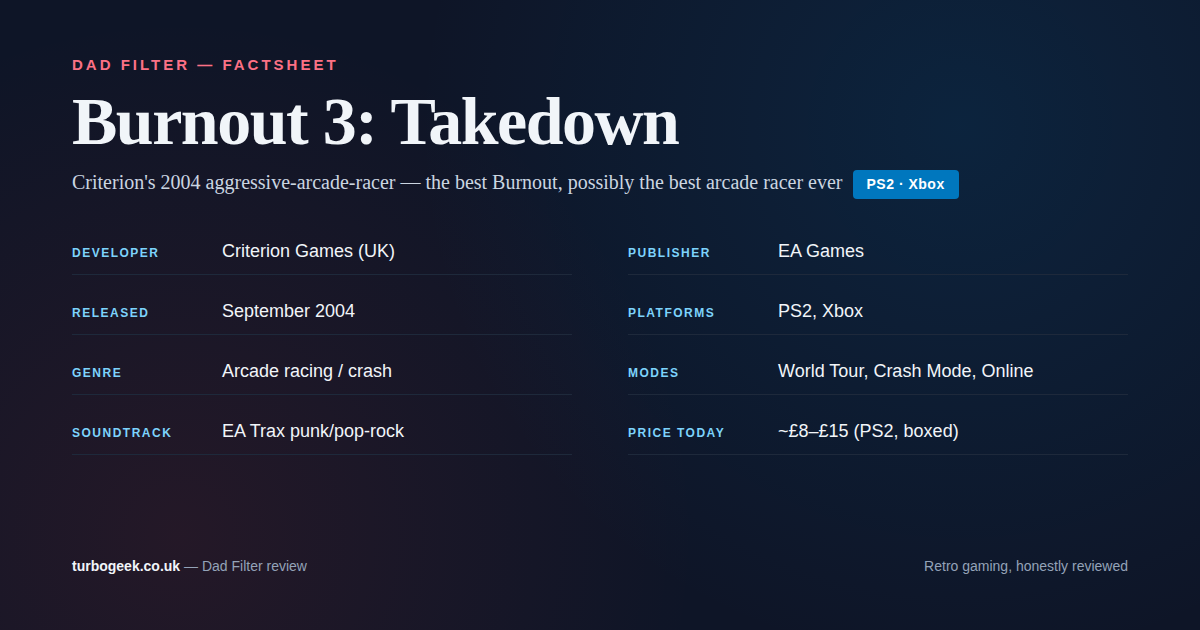
Burnout 3: Takedown on PS2: A Dad’s Return to Criterion’s 2004 Peak
Revisiting Criterion’s 2004 Burnout 3: Takedown on PS2. Aggressive arcade racing, Crash Mode, EA Trax. Still the benchmark arcade racer twenty years on. Read the guide
-
authd in Ubuntu 26.04: Why Cloud Login on Linux Suddenly Matters
Ubuntu 26.04 establishes authd as the supported framework for cloud authentication on Ubuntu. That matters because Linux desktops and servers have lagged cloud identity expectations for years. Read the guide
-
Comments Are Back on TurboGeek
The comments section was silently broken after the recent theme switch. It’s fixed now, and every comment from before is still there. Scroll to the bottom of any… Read the guide
-
Super Mario Bros. Wonder (Switch, 2023): A Dad’s Family-Game Review
Nintendo’s 2023 return to 2D Mario. 100+ levels of Wonder Flowers, four-player co-op, and the most consistently inventive platformer Nintendo has made in years. Verdict: Buy. Read the guide
-
Ubuntu Core Desktop in 2026: Why Canonical Keeps Building Toward It
Canonical’s Ubuntu 26.04 desktop roadmap explicitly says the cycle lays groundwork for Ubuntu Core Desktop. Here is what that really means, where it fits, and why the company… Read the guide
-
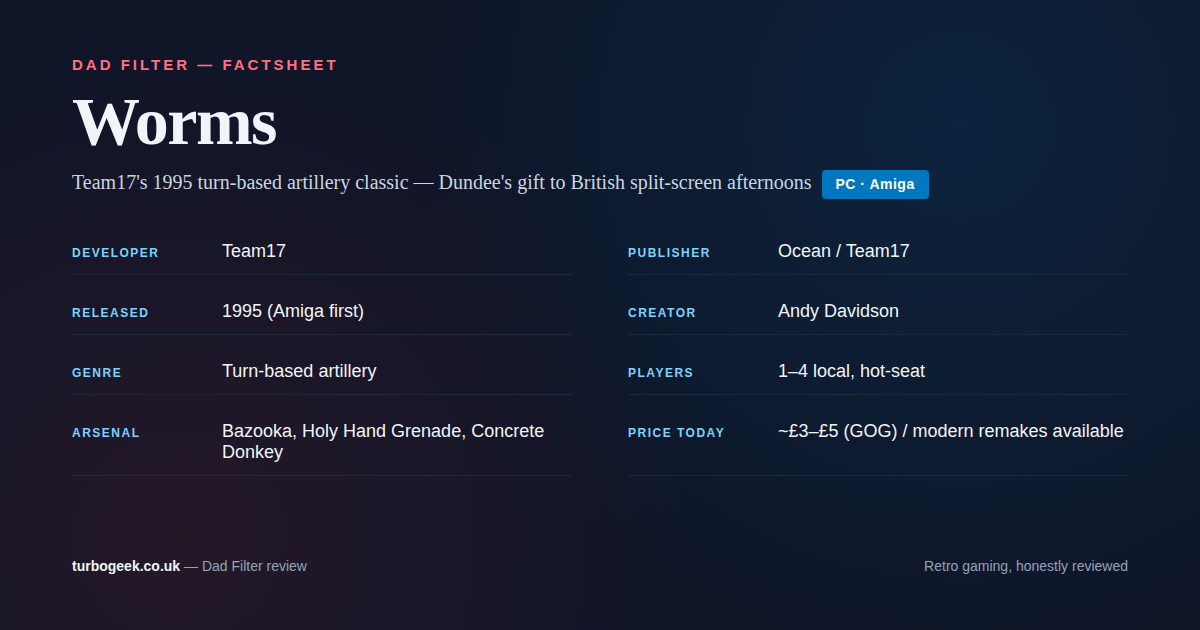
Worms on PC (1995): A Dad’s Return to Team17’s Turn-Based Artillery
Revisiting Team17’s 1995 Worms on PC. Andy Davidson’s bedroom-coded classic, the hot-seat artillery game that still plays as well as anything on the shelf. Read the guide
-
CrackArmor and AppArmor Fixes: What Ubuntu Admins Should Check
Canonical published its AppArmor vulnerability guidance on March 12, 2026. The practical message is simple: install both kernel and userspace updates, then verify your confinement story instead of… Read the guide
-
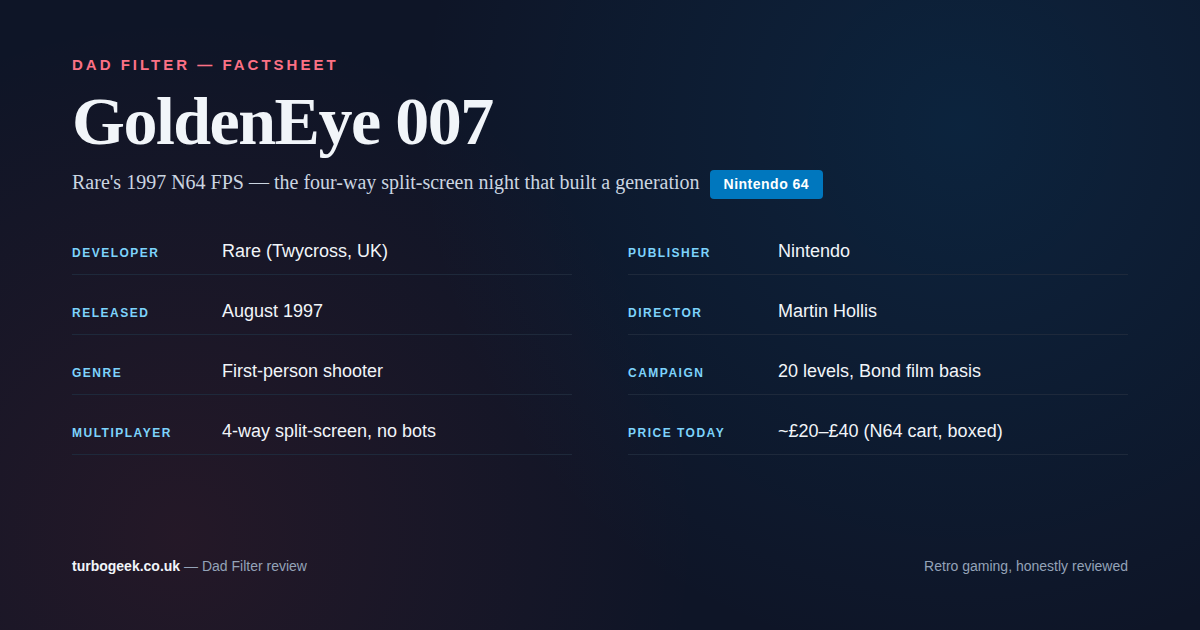
GoldenEye 007 on N64 (1997): A Dad’s Return to the Split-Screen Classic
Revisiting Rare’s 1997 N64 FPS. Nine people made it. Twenty-eight years later, four-way split-screen GoldenEye is still one of the best family gaming nights you can construct. Read the guide