
Configuring SSL/TLS to enable HTTPS on your Grafana instance is a critical step to protect your data, credentials, and visualizations. This guide provides a clear, step-by-step process for generating a self-signed SSL certificate and configuring your self-hosted Grafana server on Linux to use it.
This guide covers Grafana 9, 10, and 11. The grafana.ini configuration keys are the same across all three versions.
New to SSL on Grafana? Start with Method 1 below — it covers the fundamentals and takes about five minutes.
Source check — May 9, 2026
This refresh checked the Grafana HTTPS settings against the current Grafana HTTPS setup guide and the Grafana configuration reference. The important keys are still in the [server] section: protocol, cert_file, and cert_key.
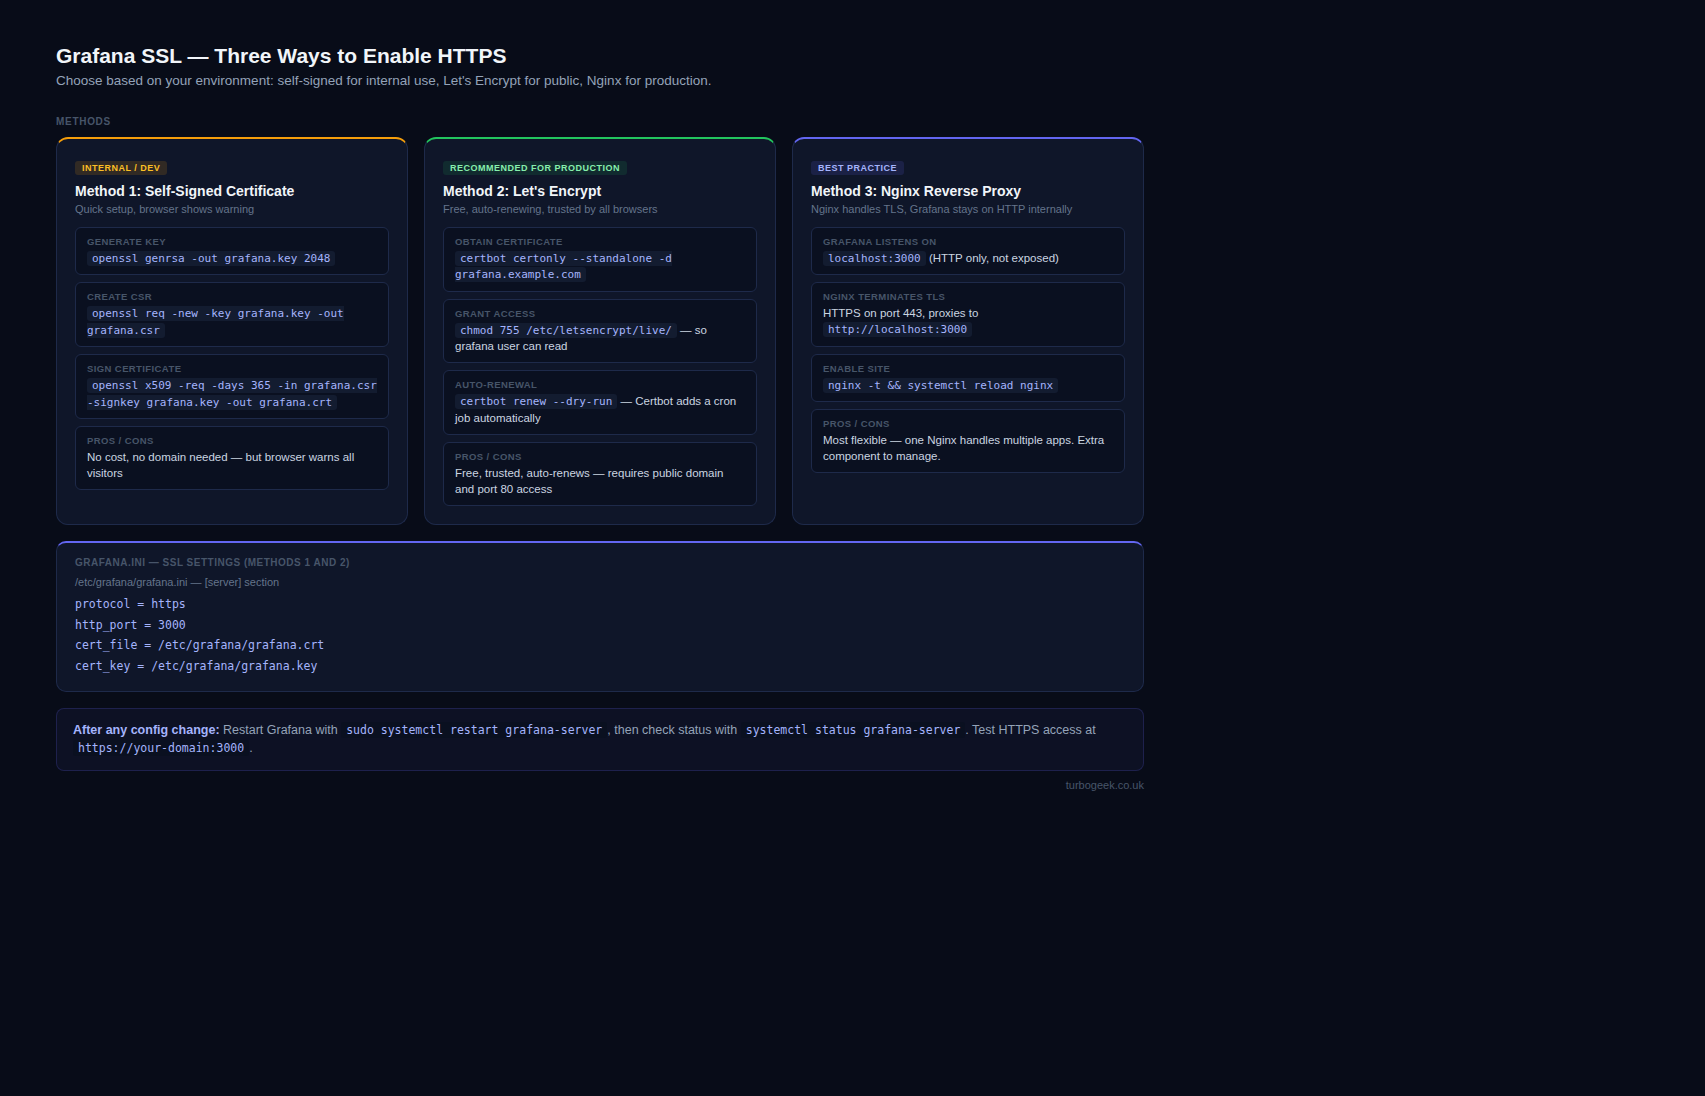
TL;DR — Grafana SSL / HTTPS
- Self-signed cert — 3 OpenSSL commands → move files to
/etc/grafana/→ updategrafana.ini→ restart. Best for internal or dev use. - Let’s Encrypt (production) — free CA-signed cert, no browser warning, auto-renews every 90 days. Requires a public domain.
- Nginx reverse proxy — best-practice production setup; Nginx terminates SSL, Grafana stays on HTTP internally.
- Config file — all methods update the
[server]section in/etc/grafana/grafana.iniwithprotocol = https,cert_file, andcert_key.
| Method | Best for | Browser warning? | Auto-renews? |
|---|---|---|---|
| Self-Signed | Internal tools, dev & testing | Yes — must accept once | No — manual renewal |
| Let’s Encrypt | Public-facing, production | No | Yes — via Certbot |
| Nginx Reverse Proxy | Multi-service setups, shared domain | No | Yes — via Certbot |
Why Should I Use HTTPS for My Grafana Instance?
You should use HTTPS because, by default, a self-hosted Grafana installation communicates over unencrypted HTTP. This means all data, including usernames, passwords, API keys, and dashboard query results, are sent in plain text. An attacker on the same network could easily intercept this traffic. Enabling SSL/TLS to force an HTTPS connection encrypts this data, ensuring confidentiality, verifying the server’s identity, and protecting against man-in-the-middle attacks.
What Do I Need to Enable SSL in Grafana?
To enable SSL, you need two primary files: a private key file (.key) and an SSL certificate file (.crt). You will also need sudo or root access to your Linux server to generate these files, modify the Grafana configuration, and restart the service.
This guide will walk you through creating both files using OpenSSL, a standard tool available on most Linux distributions. The configuration changes are made in the grafana.ini file, specifically in the [server] section.
Quick Start: All Commands at a Glance
Already familiar with SSL? Here are the complete self-signed certificate steps in one copy-pasteable block. For the full walkthrough with explanations, continue to Method 1 below.
Method 1: Self-Signed Certificate (Internal / Dev Use)
How Do I Generate a Self-Signed SSL Certificate for Grafana?
Generating a self-signed certificate involves a three-command process using OpenSSL. These steps create your private key, a certificate signing request (CSR), and finally, the certificate itself.
Open your server’s terminal and execute the following commands.
Step 1 – Generate a Private Key
This command creates a 4096-bit RSA private key named grafana.key. This key must be kept secure and private.
openssl genrsa -out grafana.key 4096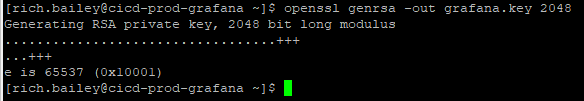
Step 2 – Create a Certificate Signing Request (CSR)
Next, create a CSR. You will be prompted to enter information like your country, organization, and a “Common Name.” The Common Name is crucial and should be the domain name or IP address you use to access Grafana.
openssl req -new -key grafana.key -out grafana.csrStep 3 – Generate the Self-Signed Certificate
Finally, use your private key and CSR to generate the SSL certificate file (grafana.crt). We’ll set it to be valid for 365 days.
openssl x509 -req -days 365 -in grafana.csr -signkey grafana.key -out grafana.crtAfter running these commands, you will have two new files in your current directory: grafana.key and grafana.crt.
An SSL certificate is a digital file that encrypts communication between your web browser and the Grafana server. It verifies the server’s identity and ensures that all data transmitted between the two remains private.
How Do I Configure Grafana to Use the New SSL Certificate?
With the certificate and key created, the next step is to place them in the correct directory, set their permissions, and tell Grafana how to use them.
Step 1 – Move the Certificate and Key Files
Move the two generated files to Grafana’s configuration directory, which is typically /etc/grafana/.
sudo mv grafana.crt grafana.key /etc/grafana/Step 2 – Set Secure File Ownership and Permissions
It is critical that only the grafana user can read these files. Change the ownership to the grafana user and group, and set the file permissions to read-only for the owner.
sudo chown grafana:grafana /etc/grafana/grafana.crt /etc/grafana/grafana.keysudo chmod 400 /etc/grafana/grafana.key /etc/grafana/grafana.crtStep 3 – Edit the grafana.ini Configuration File
Open the main Grafana configuration file with a text editor like vim or nano.
sudo vim /etc/grafana/grafana.iniSearch for the [server] section. You need to uncomment and modify the following four lines:
protocol: Change this fromhttptohttps.cert_file: Provide the full path to your certificate file.cert_key: Provide the full path to your private key file.root_url: Update this to reflect thehttpsprotocol and your full domain name.
Your final configuration should look like this:
Ini, TOML
[server]
# Protocol to use, e.g. http, https, h2, socket
protocol = https

# The full path to the SSL cert file
cert_file = /etc/grafana/grafana.crt

# The full path to the SSL key file
cert_key = /etc/grafana/grafana.key

# The full public facing url you use in browser
root_url = https://your.grafana.domain:3000
Step 4 – Restart the Grafana Service
Save your changes to the grafana.ini file and restart the Grafana service to apply them.
sudo systemctl restart grafana-serverHow Do I Access My Secure Grafana Instance?
Open your web browser and navigate to https://your.grafana.domain:3000. Because you used a self-signed certificate that your browser doesn’t recognize from a trusted authority, you will see a privacy warning like “Your connection is not private.” This is expected. You must click “Advanced” and choose to “Proceed” to your Grafana URL. After this initial acceptance, you will see the padlock icon in your address bar, confirming your connection is encrypted.
Method 2: Let’s Encrypt Certificate (Recommended for Production)
Self-signed certificates are fine for internal tools and development, but for any public-facing Grafana instance, use a free certificate from Let’s Encrypt. It eliminates the browser privacy warning, is trusted by all major browsers, and renews automatically.
Prerequisites
- A domain name pointing to your server’s public IP (e.g.
grafana.yourdomain.com) - Port 80 open on your firewall — Certbot uses an HTTP challenge for domain verification
- Certbot installed:
sudo apt install certboton Ubuntu/Debian
Step 1 — Obtain the Certificate
Run Certbot in standalone mode. This briefly starts a temporary web server on port 80 to complete domain verification. Stop Grafana or anything else using port 80 first.
sudo certbot certonly --standalone -d grafana.yourdomain.comCertbot stores the certificates in /etc/letsencrypt/live/grafana.yourdomain.com/. The two files you need are:
fullchain.pem— the full certificate chain (use ascert_file)privkey.pem— the private key (use ascert_key)
Step 2 — Grant Grafana Read Access to the Certificate
Let’s Encrypt files are owned by root. The Grafana process needs to read them:
Step 3 — Update grafana.ini
Edit /etc/grafana/grafana.ini and update the [server] section:
Step 4 — Restart Grafana and Test Auto-Renewal
Certbot installs a systemd timer on Ubuntu 20.04+ that runs renewal checks twice daily. To reload Grafana automatically after each renewal, add a deploy hook:
Method 3: Nginx as an SSL Reverse Proxy (Best Practice)
Running Grafana behind an Nginx reverse proxy is the most common production pattern. Nginx terminates the HTTPS connection and forwards plain HTTP to Grafana on localhost. This approach gives you several advantages over configuring SSL directly in Grafana:
- Serve multiple services on port 443 from one server
- Centralised certificate and TLS policy management
- Grafana never needs to be exposed on a public port
- Easier integration with Certbot (Nginx plugin handles cert issuance and config)
Step 1 — Configure Grafana for Proxied Access
In this setup, Grafana runs on HTTP internally and is not publicly exposed. Update /etc/grafana/grafana.ini:
Setting
root_urlto the HTTPS address is important. Without it, links that Grafana generates internally (alert notification URLs, embedded panel links) will use HTTP instead of HTTPS.
Step 2 — Create the Nginx Site Configuration
Create /etc/nginx/sites-available/grafana with the following content. This configuration redirects all HTTP traffic to HTTPS and proxies the HTTPS request to Grafana on port 3000. Adjust the ssl_certificate paths for your certificate source:
Step 3 — Enable the Site and Reload Nginx
Grafana is now accessible at https://grafana.yourdomain.com with no port number. Port 3000 remains only accessible from localhost.
Docker: Configuring Grafana SSL via Environment Variables
When running Grafana in Docker, the recommended approach is to use environment variables instead of editing grafana.ini directly. Every grafana.ini setting maps to a GF_ environment variable.
The typical Docker setup mounts your certificate files as volumes and sets the SSL configuration via -e flags or a docker-compose.yml:
The certificate and key files are mounted read-only (:ro) from a certs/ directory on the host. Generate them using the OpenSSL commands from Method 1, or point the volume mount at your Let’s Encrypt paths instead.
Troubleshooting Common Grafana SSL Errors
Why won’t Grafana start after I enabled HTTPS?
This is usually due to an incorrect file path in grafana.ini or improper file permissions. Double-check that the cert_file and cert_key paths are correct. Then, verify that the grafana user has read permissions for both files using sudo -u grafana cat /etc/grafana/grafana.crt. If the command fails, your permissions are incorrect.
Why do I still get a “Certificate not trusted” error in my browser?
This error is normal and expected for self-signed certificates. Your browser has no way of verifying the identity of the certificate’s issuer (which is you). To avoid this in a production setting, you must use a certificate issued by a trusted third-party Certificate Authority (CA) like Let’s Encrypt or DigiCert.
Can I use this method for Grafana in a Docker container?
Yes, the principle is the same. You would typically generate the certificates on the host machine and then use a Docker volume to mount them into the container at /etc/grafana/. You would also need to pass the configuration variables (or a mounted grafana.ini file) and ensure the container’s HTTPS port is exposed to the host. See the Docker section above for a complete docker-compose.yml example.
Grafana starts but I see “permission denied” in the logs when reading the key file.
The Grafana process runs as the grafana user and must be able to read both files. Run sudo -u grafana cat /etc/grafana/grafana.key — if that fails, permissions are wrong. Fix with: sudo chown grafana:grafana /etc/grafana/grafana.key /etc/grafana/grafana.crt && sudo chmod 400 /etc/grafana/grafana.key.
I’m behind an Nginx reverse proxy but Grafana still generates http:// links in alert notifications.
You must set root_url = https://grafana.yourdomain.com/ in the [server] section of grafana.ini. Without this, Grafana doesn’t know it is being served over HTTPS and generates HTTP links in all internal URLs — alerts, embedded panels, and share links.
Official cross-check: Grafana’s own documentation calls out HTTPS for encrypting browser traffic, including login credentials and dashboard query data. It also documents cert_file and cert_key as certificate paths used when protocol is set to https or h2.
Can I use a wildcard certificate (e.g. *.yourdomain.com) with Grafana?
Yes. Obtain a wildcard cert using Certbot with a DNS challenge: sudo certbot certonly --manual --preferred-challenges dns -d *.yourdomain.com. Then point cert_file and cert_key in grafana.ini at the resulting fullchain.pem and privkey.pem as in Method 2.
Conclusion
Securing your Grafana server with SSL/TLS is a non-negotiable step for protecting your data. By following this guide, you have successfully enabled HTTPS encryption using a self-signed certificate. For those running production systems, remember to consider graduating to a CA-signed certificate for a more professional and seamless user experience, especially if you are comparing the features available in the Grafana Enterprise edition.
Need a Linux VPS to try this on?
I host my own lab work on Atlantic.Net Cloud — straightforward Linux VPS pricing, hourly billing, and snapshots that make it easy to break things and roll back. Their dedicated and HIPAA-compliant hosting tiers are worth a look if you outgrow the cloud plans.
Disclosure: This is an affiliate/referral link. If you sign up I may earn credit at no extra cost to you. I work as a freelance writer for Atlantic.Net and use their services personally — I wouldn’t link them otherwise.
What to know more about Grafana SSL? Check out our other posts about it:
Learn:
- What’s the difference between the Grafana Enterprise and Grafana Community editions?
- Why should I use Grafana?
- How do I install Grafana on a Raspberry Pi?
- Your Top Grafana Questions Answered (Q&A)
Thanks for taking the time to read this article. if you have any questions or feedback, please write in the comment section below.
Leave a Reply