
As IT professionals, we always look for powerful and cost-effective tools to help us monitor and visualize data. Enter Grafana, an open-source platform that allows us to create interactive and customizable dashboards to display real-time metrics and analytics. And what’s even better? We can run Grafana on a Raspberry Pi, a small but mighty single-board computer perfect for running various applications.
In this article, we’ll dive into the world of Grafana and show you how to install it on a Raspberry Pi. We’ll provide you with step-by-step instructions and some valuable tips and tricks we’ve learned through our experience in the field. Whether you’re a seasoned IT pro or just getting started, this guide will equip you with the knowledge you need to get the most out of Grafana on your Raspberry Pi. So, let’s get started!
Yes, Grafana can run on a Raspberry Pi. I use a Pi V4 with 8GB RAM; even though these specs are overkill for Grafana, I have plenty of other tools running on my Pi. The Pi is running Raspbian OS.
Quick Answer
- Add the Grafana APT repository and import the GPG key
- Run
sudo apt update && sudo apt install grafana - Enable and start the service:
sudo systemctl enable --now grafana-server - Open port 3000 on your firewall if required
- Access Grafana at
http://your-pi-ip:3000— default login is admin / admin
How to Install Grafana?
Follow these quick steps:
Step 1 – Enable the Grafana Repo
sudo mkdir -p /etc/apt/keyrings/
sudo wget -q -O - https://apt.grafana.com/gpg.key | gpg --dearmor > /etc/apt/keyrings/grafana.gpg
sudo echo "deb [signed-by=/etc/apt/keyrings/grafana.gpg] https://apt.grafana.com stable main" | tee /etc/apt/sources.list.d/grafana.list
Note: If you experience any issues with the Grafana keys, check out their official documentation.
Step 2 – Update OS and Install Grafana
sudo apt update -y
sudo apt-get install -y grafana
Need a Grafana SSL Certificate? – Learn how to create and install one now.
You should see output like this:
richard@raspberrypi:~ $ sudo su -
root@raspberrypi:~# mkdir -p /etc/apt/keyrings/
wget -q -O - https://apt.grafana.com/gpg.key | gpg --dearmor > /etc/apt/keyrings/grafana.gpg
echo "deb [signed-by=/etc/apt/keyrings/grafana.gpg] https://apt.grafana.com stable main" | tee /etc/apt/sources.list.d/grafana.list
deb [signed-by=/etc/apt/keyrings/grafana.gpg] https://apt.grafana.com stable main
root@raspberrypi:~# sudo apt update -y
sudo apt-get install -y grafana
sudo /bin/systemctl enable grafana-server
sudo /bin/systemctl start grafana-server
Hit:1 http://deb.debian.org/debian bookworm InRelease
Hit:2 http://deb.debian.org/debian-security bookworm-security InRelease
Hit:3 http://deb.debian.org/debian bookworm-updates InRelease
Hit:4 http://archive.raspberrypi.com/debian bookworm InRelease
Get:5 https://apt.grafana.com stable InRelease [5,983 B]
Get:6 https://apt.grafana.com stable/main arm64 Packages [147 kB]
Get:7 https://apt.grafana.com stable/main armhf Packages [114 kB]
Fetched 266 kB in 2s (137 kB/s)
Reading package lists... Done
Building dependency tree... Done
Reading state information... Done
4 packages can be upgraded. Run 'apt list --upgradable' to see them.
Reading package lists... Done
Building dependency tree... Done
Reading state information... Done
The following additional packages will be installed:
  musl
The following NEW packages will be installed:
  grafana musl
0 upgraded, 2 newly installed, 0 to remove and 4 not upgraded.
Need to get 101 MB of archives.
After this operation, 384 MB of additional disk space will be used.
Get:1 http://deb.debian.org/debian bookworm/main arm64 musl arm64 1.2.3-1 [392 kB]
Get:2 https://apt.grafana.com stable/main arm64 grafana arm64 10.2.3 [100 MB]
Fetched 101 MB in 22s (4,656 kB/s)
Selecting previously unselected package musl:arm64.
(Reading database ... 125810 files and directories currently installed.)
Preparing to unpack .../musl_1.2.3-1_arm64.deb ...
Unpacking musl:arm64 (1.2.3-1) ...
Selecting previously unselected package grafana.
Preparing to unpack .../grafana_10.2.3_arm64.deb ...
Unpacking grafana (10.2.3) ...
Setting up musl:arm64 (1.2.3-1) ...
Setting up grafana (10.2.3) ...
Adding system user `grafana' (UID 112) ...
Adding new user `grafana' (UID 112) with group `grafana' ...
Not creating home directory `/usr/share/grafana'.
### NOT starting on installation, please execute the following statements to configure grafana to start automatically using systemd
 sudo /bin/systemctl daemon-reload
 sudo /bin/systemctl enable grafana-server
### You can start grafana-server by executing
 sudo /bin/systemctl start grafana-server
Processing triggers for man-db (2.11.2-2) ...
Synchronizing state of grafana-server.service with SysV service script with /lib/systemd/systemd-sysv-install.
Executing: /lib/systemd/systemd-sysv-install enable grafana-server
Created symlink /etc/systemd/system/multi-user.target.wants/grafana-server.service → /lib/systemd/system/grafana-server.service.
Step 3 – Enable the Grafana Service
It’s best practice to enable Grafana to start every time the Raspberry Pi reboots:
sudo /bin/systemctl daemon-reload
sudo /bin/systemctl enable grafana-server
sudo /bin/systemctl start grafana-server
Step 4 – Browse to Grafana
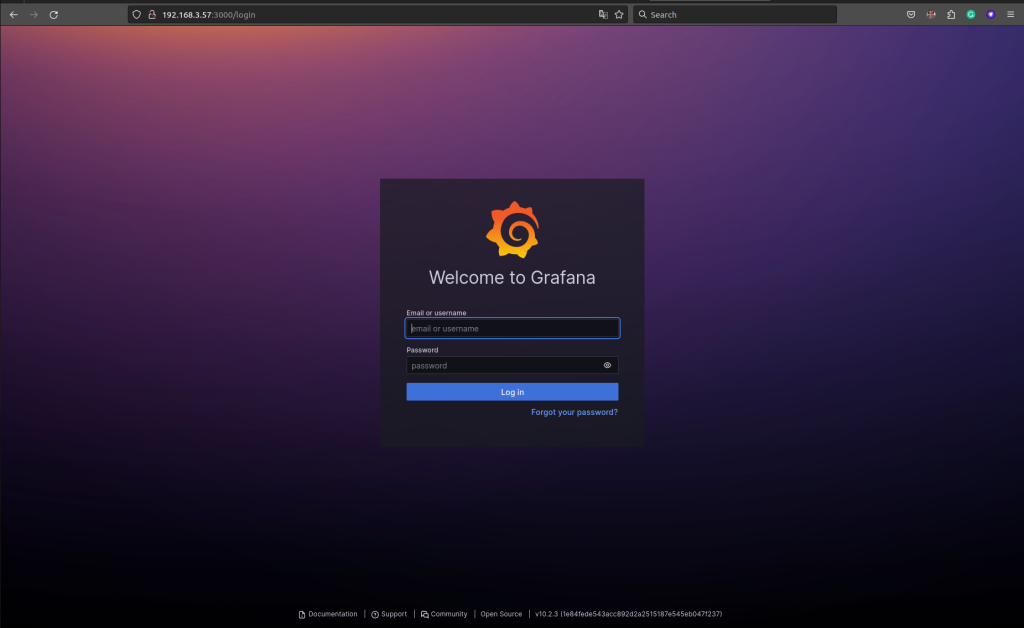
Now browse to your IP address at port 3000 to view Grafana.
Note: The default login details are admin / admin
Quick Video Guide to Install Grafana on a Raspberry Pi
Check out this YouTube video I created that shows how simple this process is.
Thats it. Thanks for reading. We well all feedback and comments in the section below.
Q&A: Grafana on Raspberry Pi – Your Questions Answered
Q1: Can I really run Grafana on a Raspberry Pi? What model should I use?
A: Absolutely! Grafana runs smoothly on a Raspberry Pi. While you can use models like the Pi 3 or Pi 4, the article author recommends a Pi 4 with 8GB RAM for optimal performance, especially if you’re running other applications on the Pi.
Q2: Which operating system is best for running Grafana on a Raspberry Pi?
A: The author successfully uses Raspbian OS in the article. It’s a popular and well-supported choice for Raspberry Pi projects.
Q3: The installation steps look a bit technical. Is there an easier way to install Grafana?
A: The article provides a detailed, step-by-step guide that’s easy to follow even if you’re not a Linux expert. If you prefer a visual guide, there’s also a quick video walkthrough available in the article.
Q4: I’m worried about security. Can I add an SSL certificate to my Grafana installation?
A: Yes, you can! The article includes a link to a guide on how to create and install an SSL certificate for your Grafana setup on Raspberry Pi.
Q5: What can I monitor with Grafana on my Raspberry Pi?
A: Grafana is incredibly versatile! You can monitor a wide range of things, from system metrics like CPU and memory usage to network traffic, sensor data, and even custom metrics from your own applications.
Q6: Is there a cost associated with using Grafana on Raspberry Pi?
A: Grafana itself is open-source and free to use. However, you might incur costs depending on the data sources you integrate and any additional services you use in conjunction with Grafana.
Q7: Where can I find more resources to help me get started with Grafana?
A: The official Grafana documentation is a great place to start. You can also find numerous tutorials, forums, and communities online dedicated to Grafana. Feel free to leave a comment below if you have any further questions!pen_spark
Leave a Reply