Category
Category: Grafana
Grafana dashboard tutorials for visualising metrics, setting up alerts, and monitoring infrastructure and applications.
-

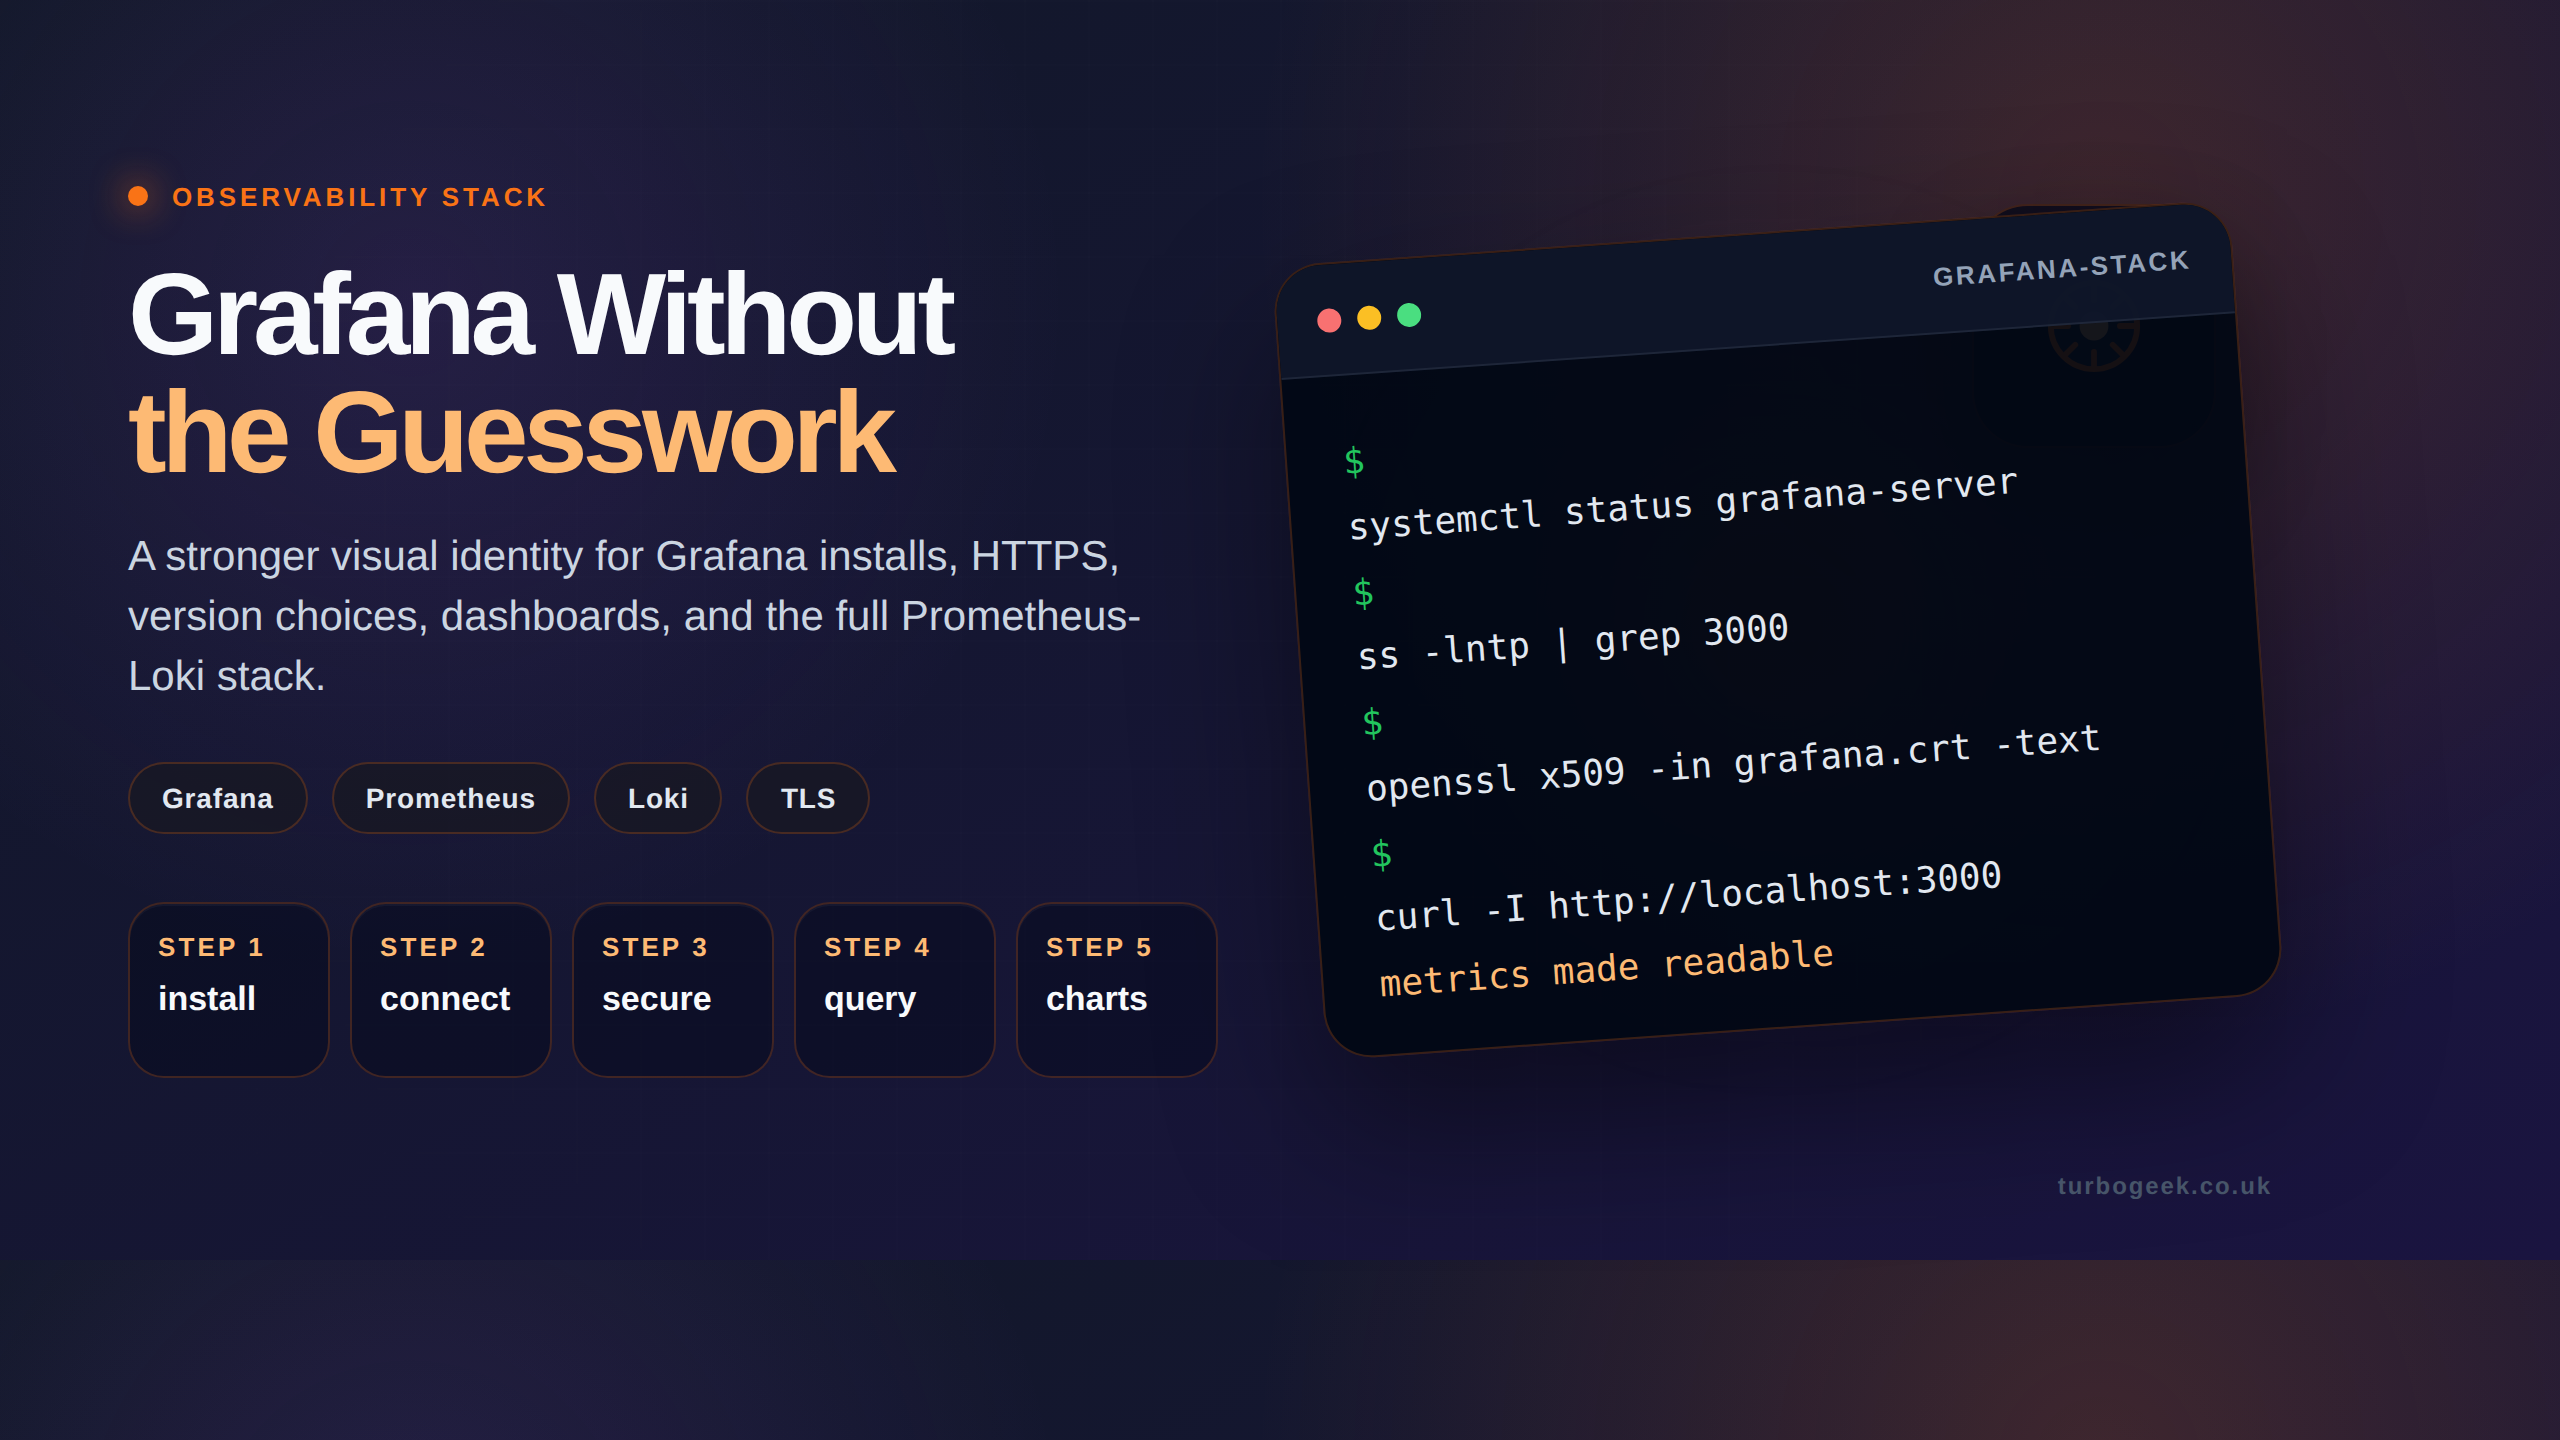
How to Install Grafana and Prometheus on Ubuntu 24.04
This guide provides a secure and efficient method for deploying a monitoring stack on Ubuntu 24.04. You will install Prometheus to collect metrics, Node Exporter to expose system… Read the guide
-
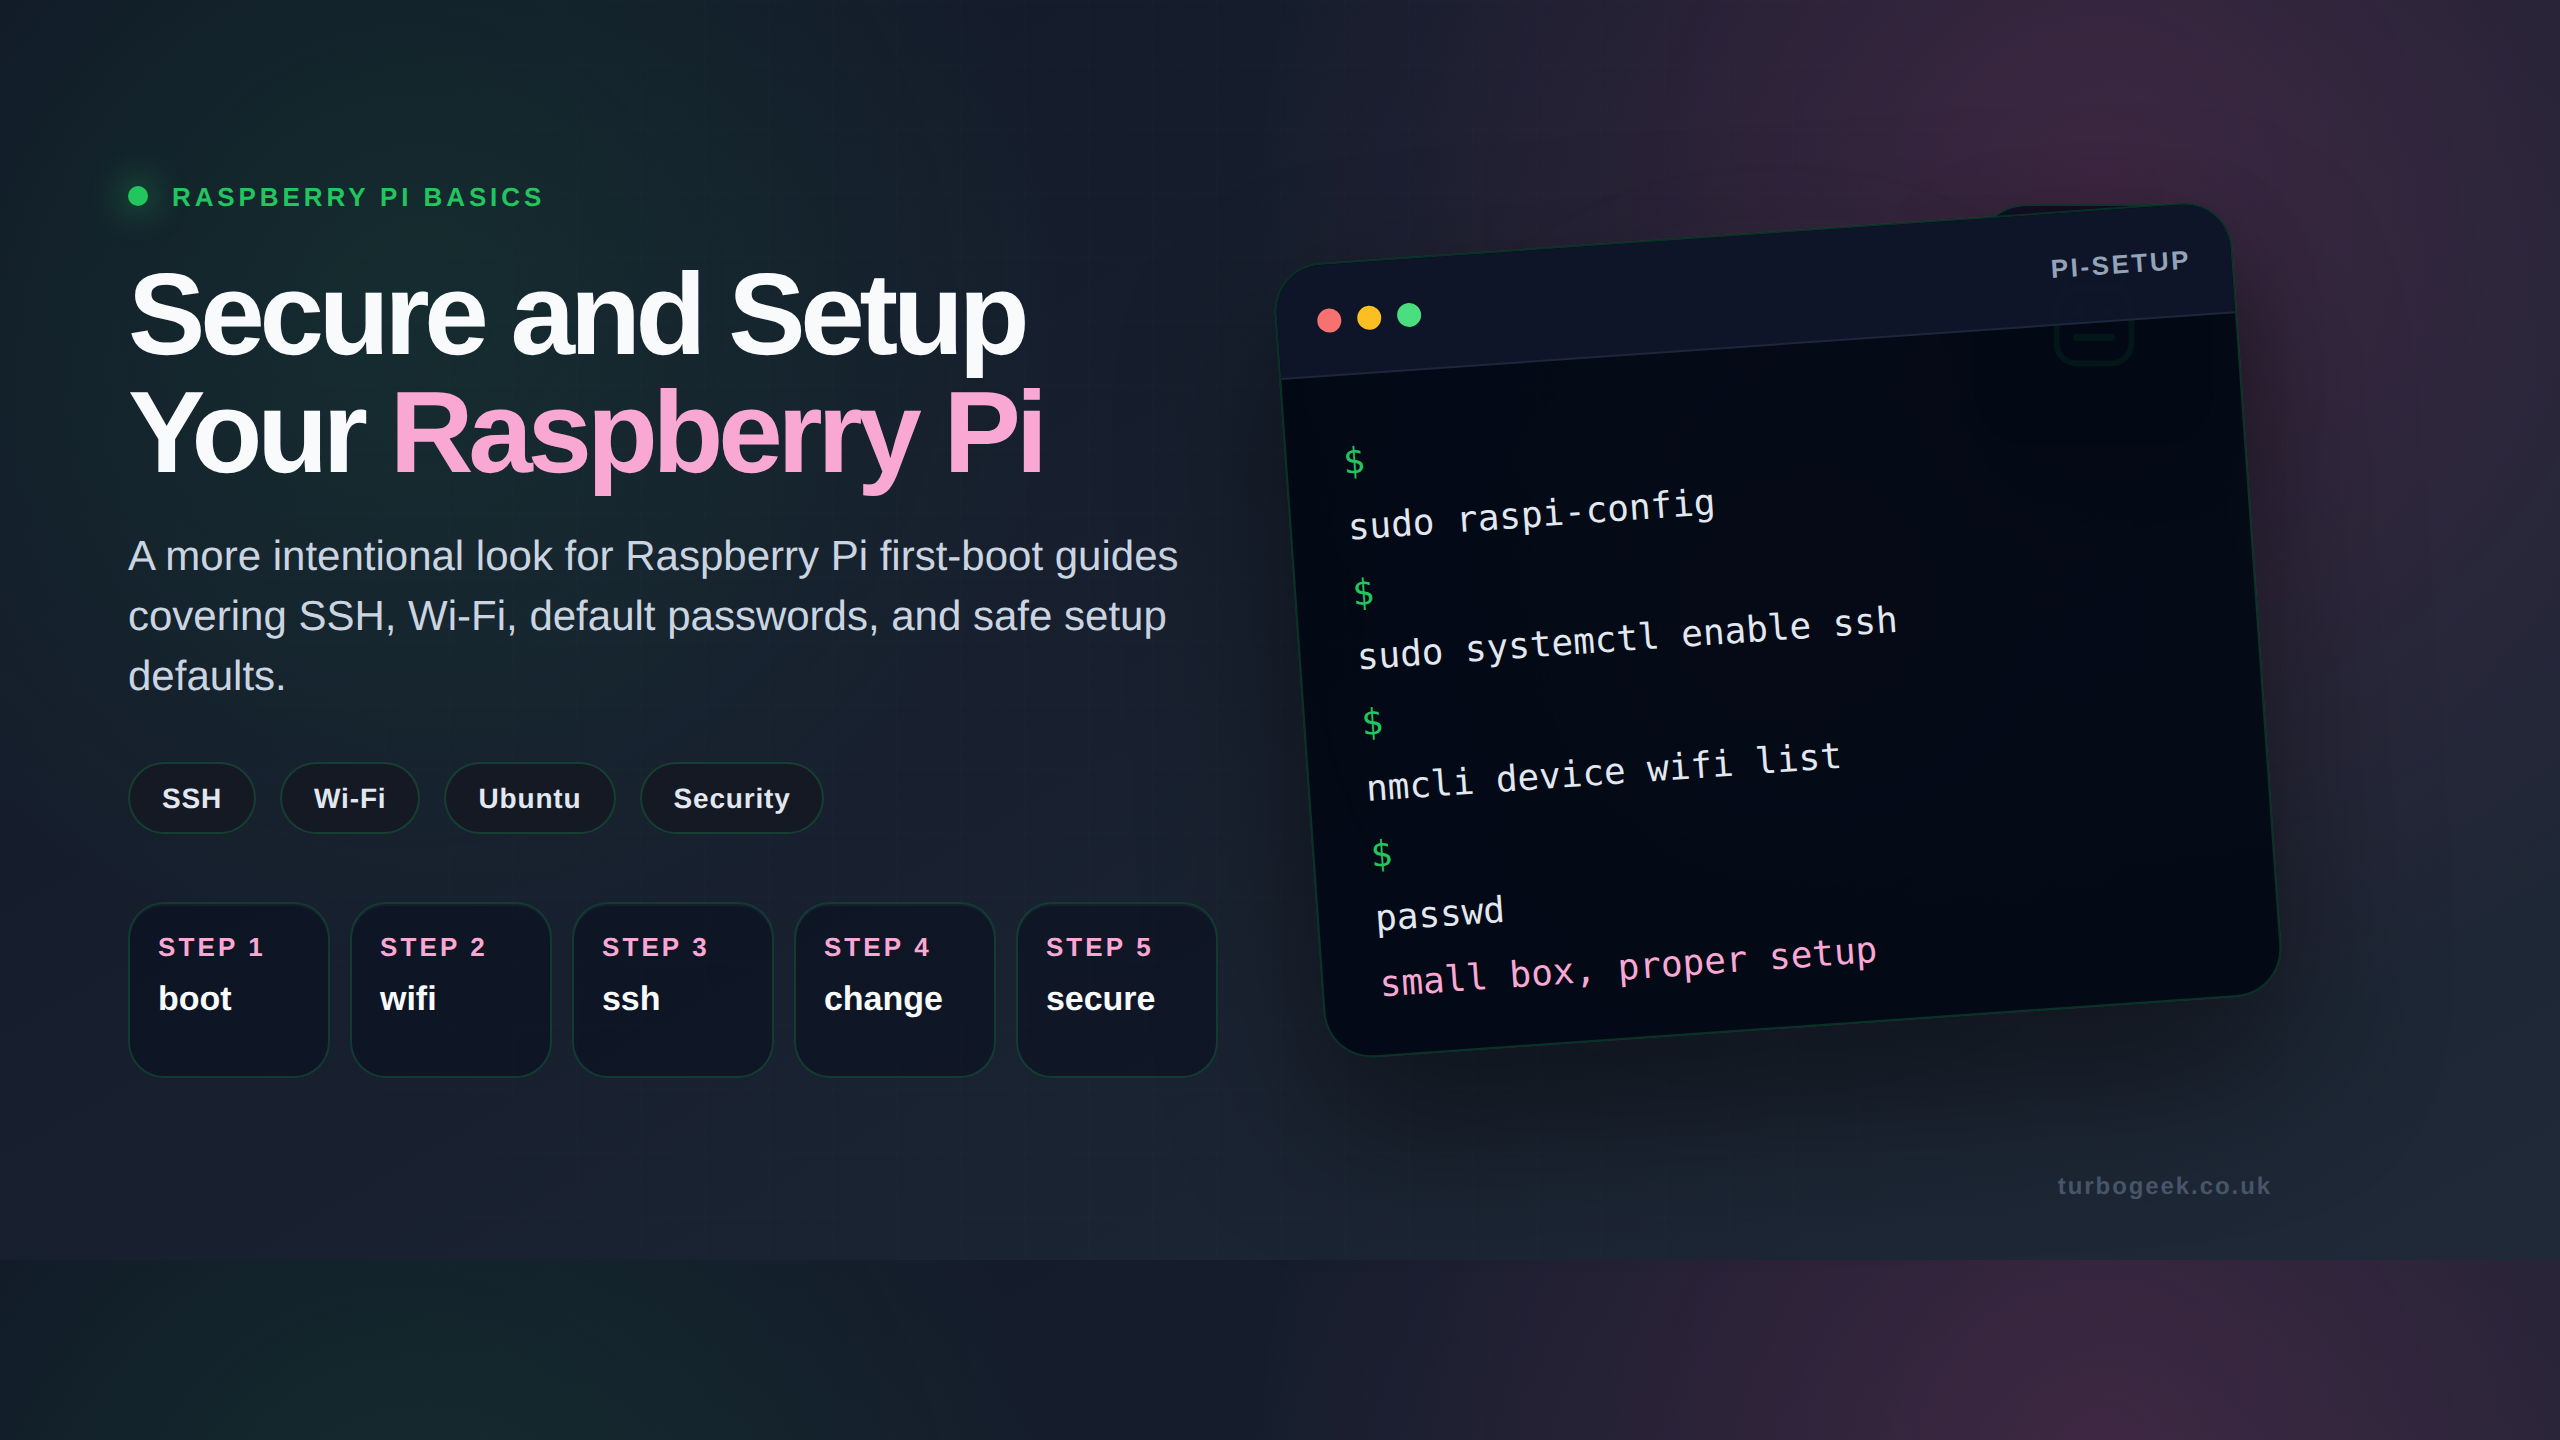
How to Install Grafana on a Raspberry Pi
As IT professionals, we always look for powerful and cost-effective tools to help us monitor and visualize data. Enter Grafana, an open-source platform that allows us to create… Read the guide
-
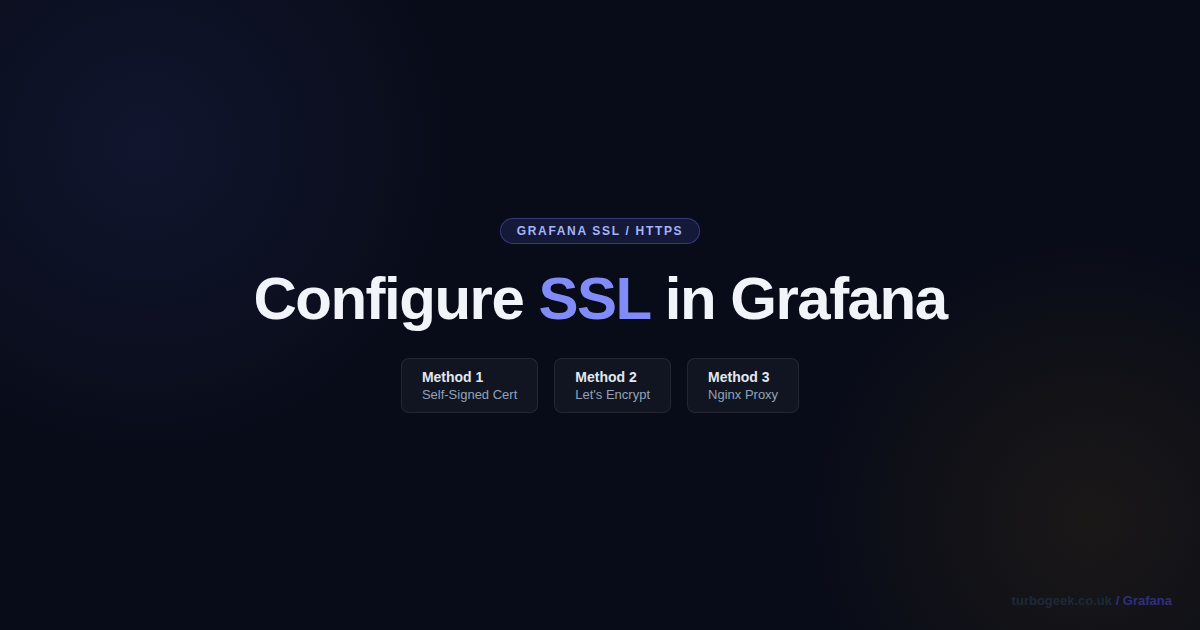
How to Configure Grafana SSL for a Secure HTTPS Connection (Step-by-Step)
Configuring SSL/TLS to enable HTTPS on your Grafana instance is a critical step to protect your data, credentials, and visualizations. This guide provides a clear, step-by-step process for… Read the guide