
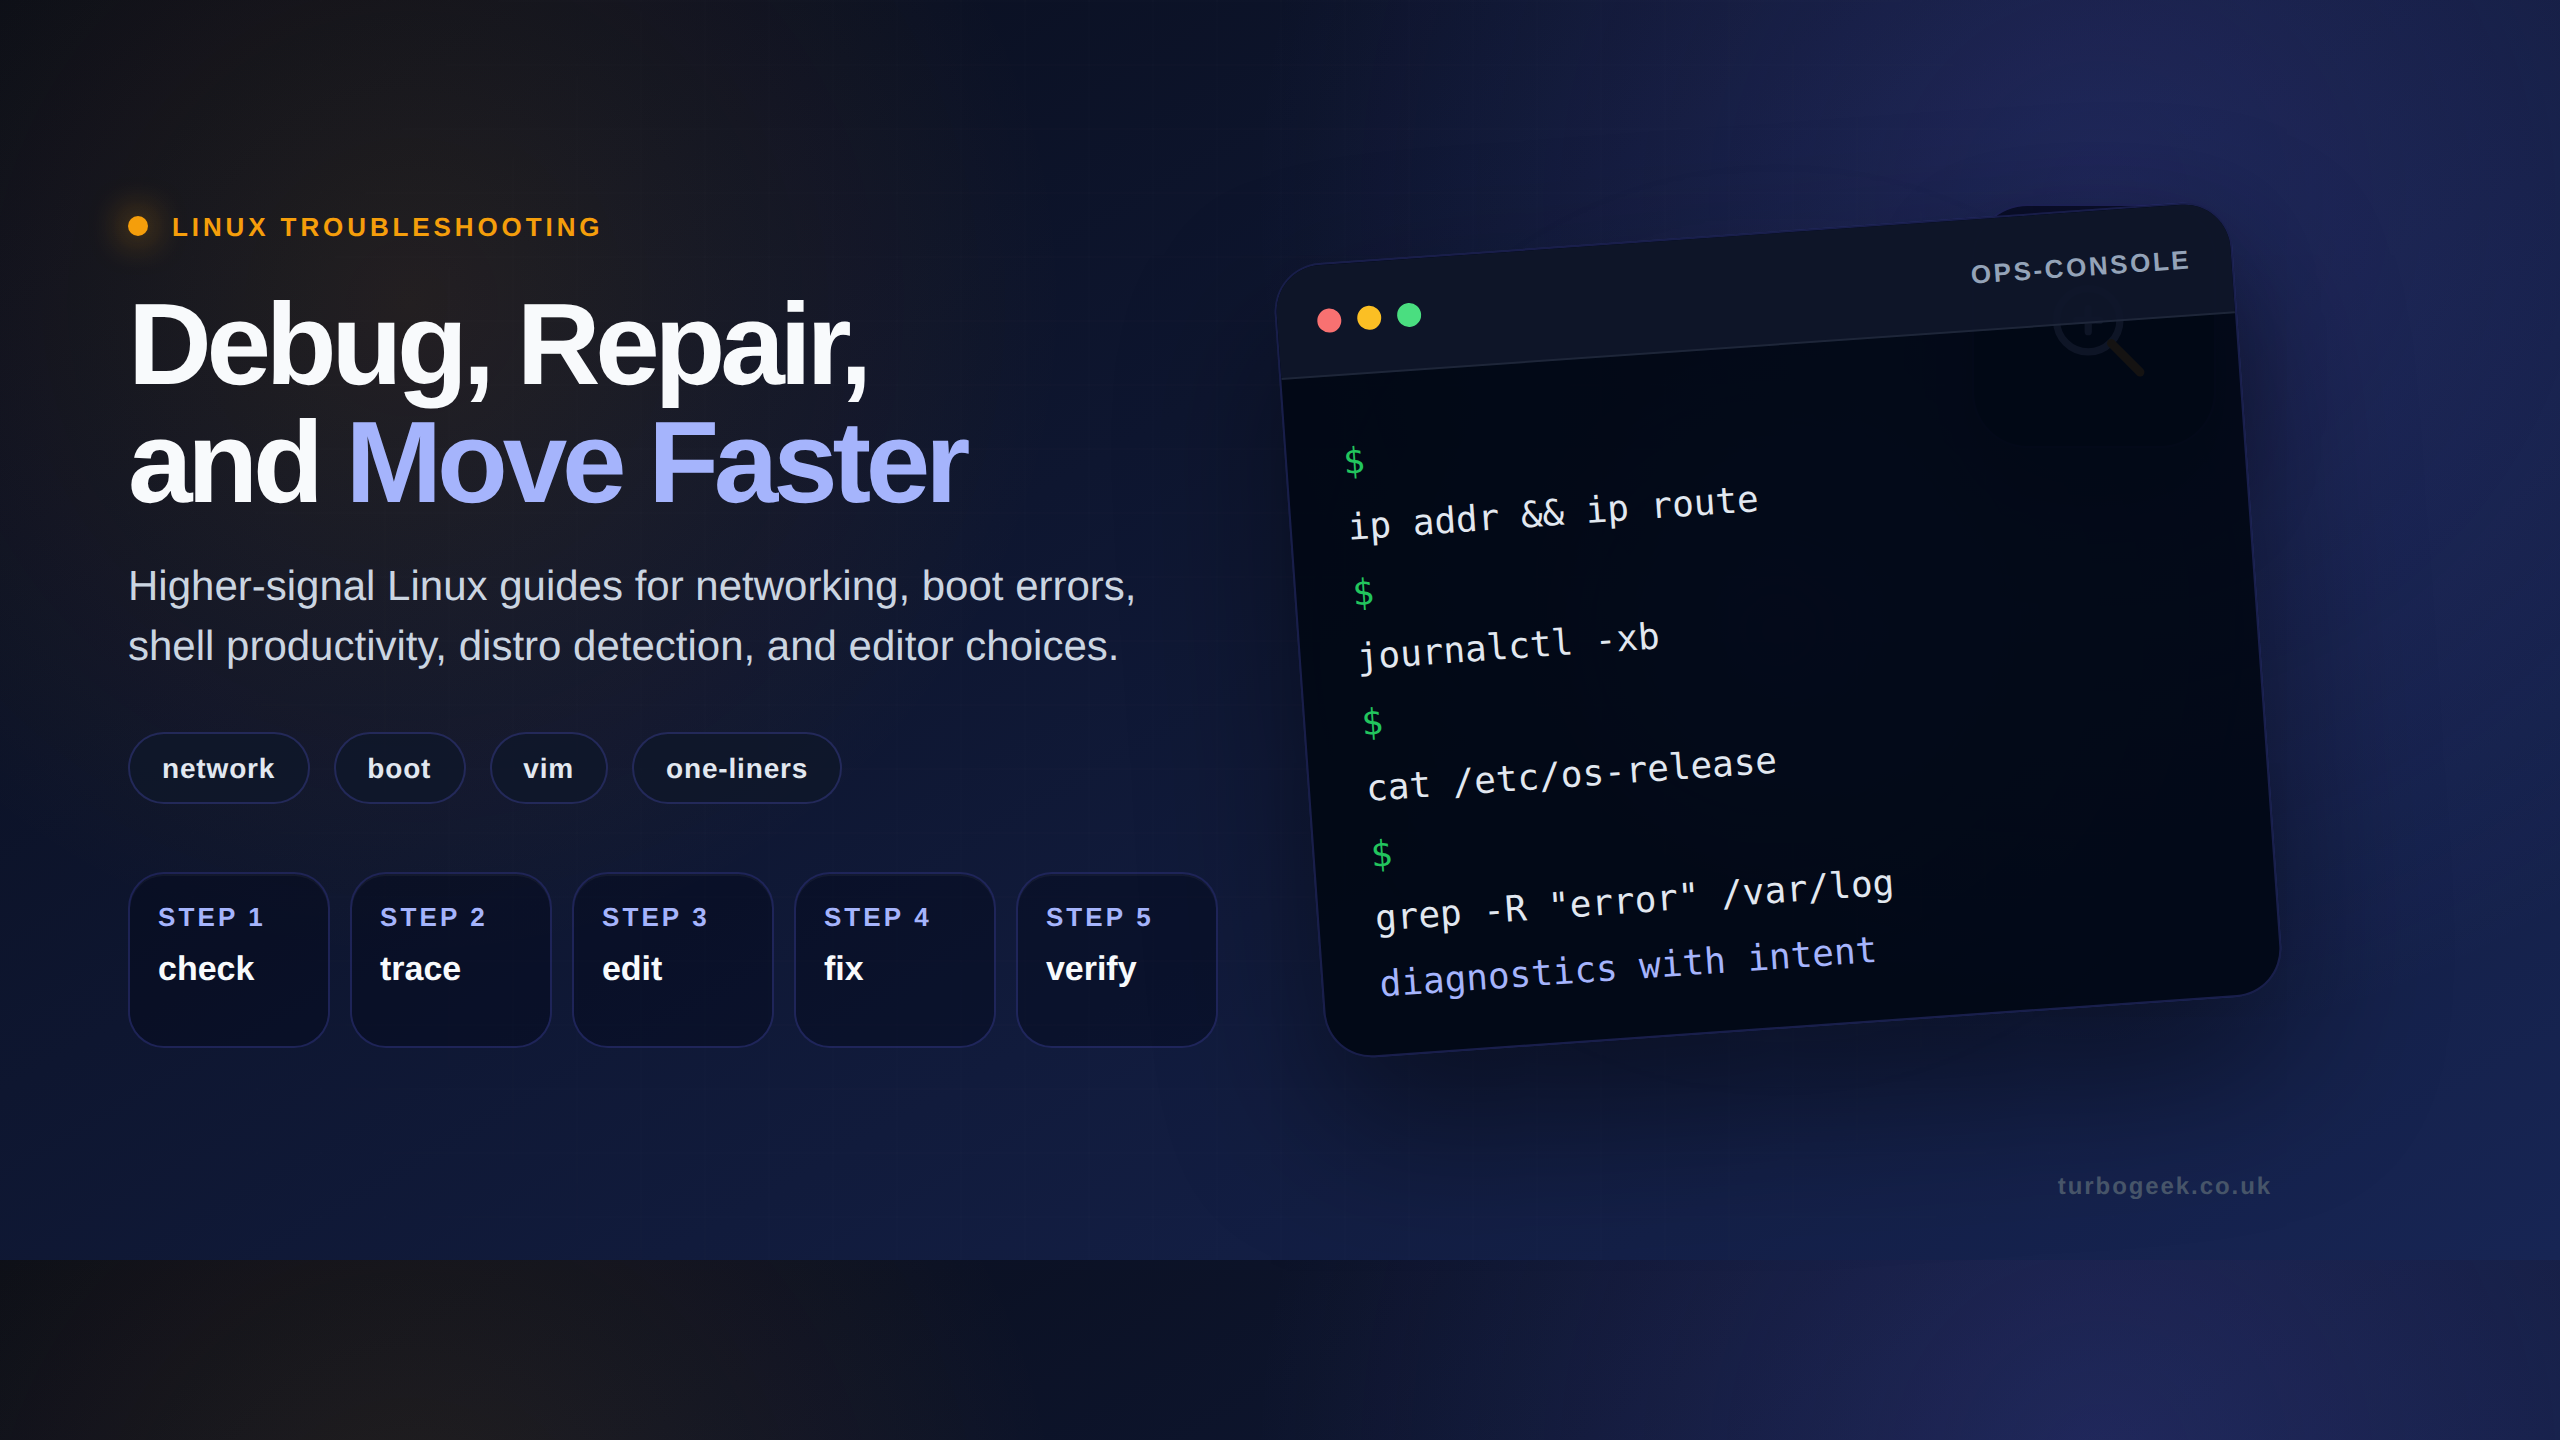
Linux is renowned for its powerful command-line interface. Mastering Linux one-liners isn’t just about saving time; it’s about maximizing operational efficiency and gaining deep visibility into your system’s performance. These concise commands pack a punch, allowing you to perform complex tasks with ease.
In our testing, we’ve found that high-level DevOps engineers and System Administrators rely on these “scripts in a single line” to bypass clunky GUIs and automate repetitive workflows. This guide provides a collection of essential Linux one-liners updated for 2026 standards, categorized for quick access with technical breakdowns.
⚡ Quick Answer: What are Linux One-Liners?
Linux one-liners are concise, powerful command sequences executed in a single line of a terminal. They leverage pipes (|) and logical operators (&&, ||) to chain multiple utilities together, enabling complex data processing, system monitoring, and automation without the need for full script files.
System Information:
Lets start with a few simple examples to warm us up. Don’t worry, we will get to the complex one liners quickly!
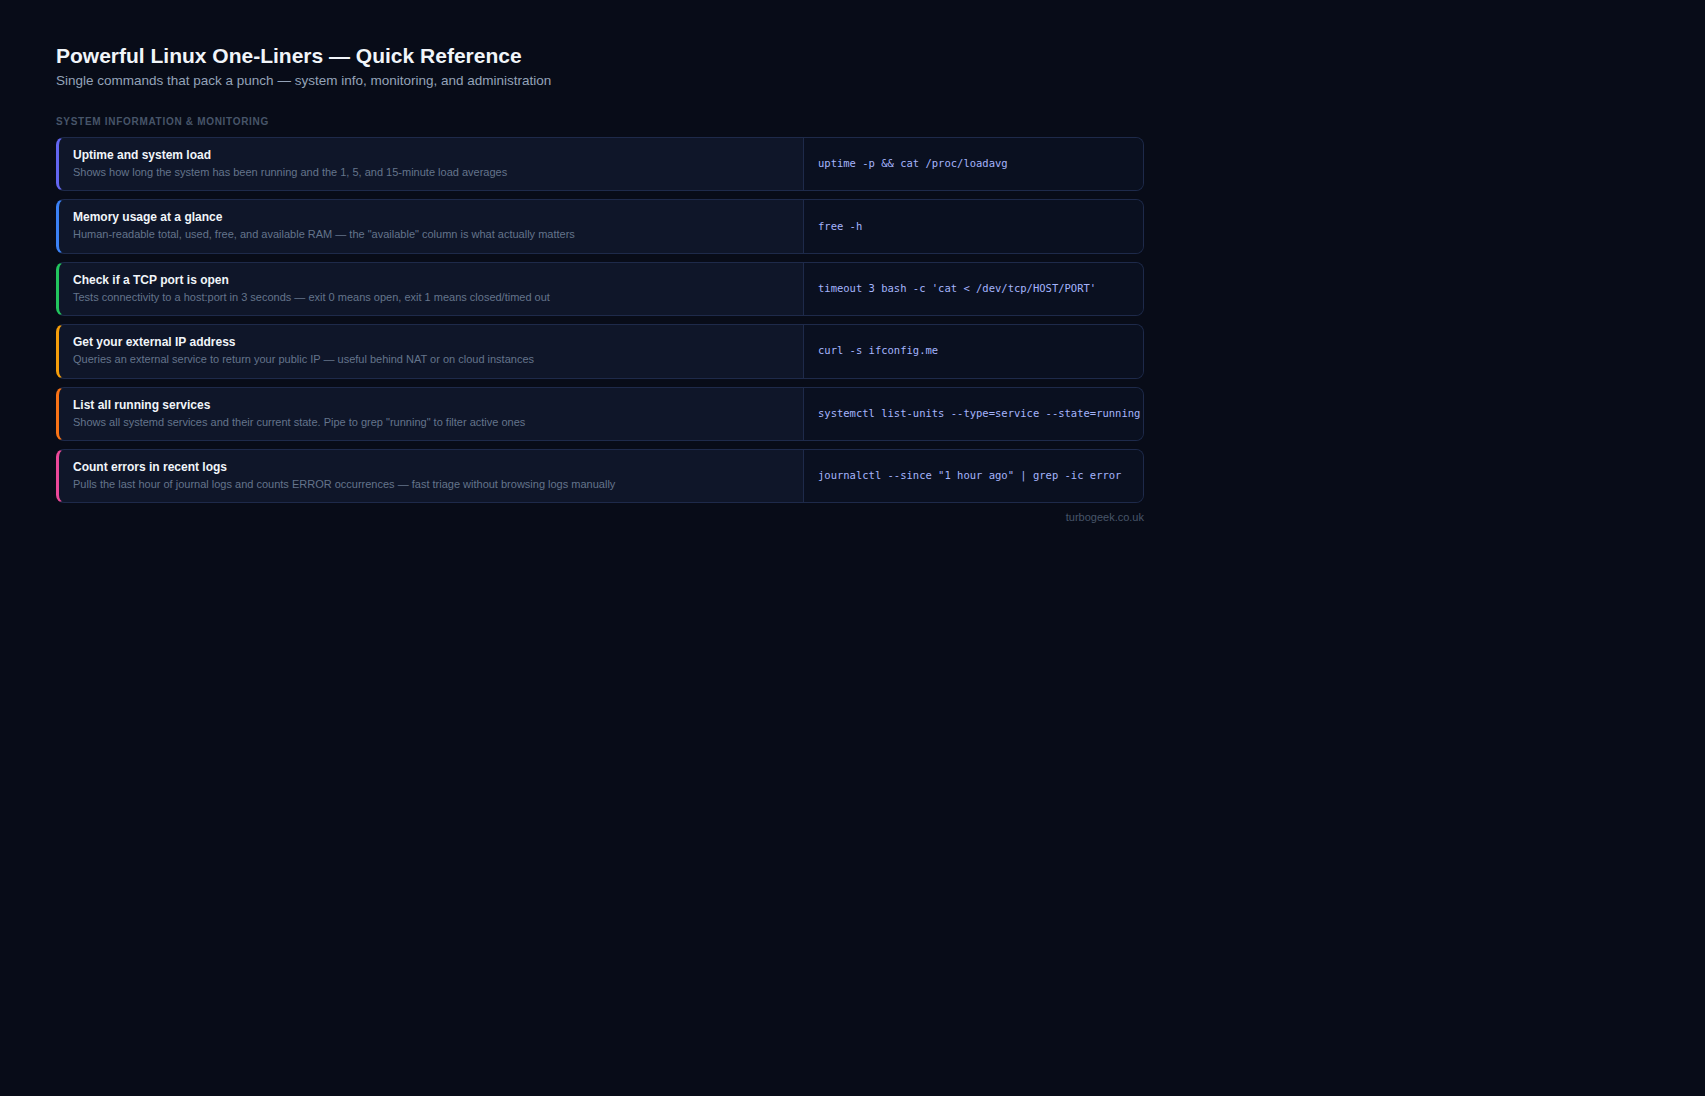
Display System Uptime and Load Average:
This provides a quick and clear view of your system’s uptime and current load averages.
uptime -p && uptimeCommand Explanation:
uptime: The standarduptimecommand is then run to show the full output, including system time, logged-in users, and load averages for the past 1, 5, and 15 minutes.uptime -p: The-p(pretty) flag displays only the uptime in a clear, human-readable format (e.g.,up 2 weeks, 3 days, 4 hours).&&: This logical operator ensures the second command only runs if the first is successful.
Check if a Specific TCP Port is Open:
This uses netcat to check if a port is open on the local machine. This is invaluable for network troubleshooting and firewall configuration.
nc -zv localhost 80Command Explanation:
nc: Thenetcatutility for network operations.-z: Putsncin scanning mode, where it listens for a short period without sending data.-v: Enables verbose output, which provides helpful feedback like “succeeded!”localhost 80: The target host and port. Replace80with the port you wish to check.
Get Your External IP Address:
This command uses curl to fetch your public IP address from a reliable external service.
curl ifconfig.meList All Running Services:
This provides a comprehensive list of all active services managed by systemd, the modern standard for service management on most Linux distributions.
systemctl list-units --type=service --state=runningCommand Explanation:
systemctl: The primary control interface for thesystemdinit system.list-units: The command to list units known tosystemd.--type=service: Filters the list to show only service units.--state=running: Further filters the list to show only services that are currently in a “running” state.
Advanced One Liners
Print Login Session Information
Find a count of the most frequent users who have logged onto your system.
last -n 50 | grep -v "^$" | awk '{print $1}' | sort | uniq -c | sort -nr | head -n 20Command Explanation:
This pipeline takes the system’s login history and aggregates it to show which user accounts are used most often.
last -n 50: Shows a list of the last 50 login sessions on the system.grep -v "^$": Filters out any blank lines from the output.awk '{print $1}': Processes the output and prints only the first column, which is the username.sort: Sorts the list of usernames alphabetically. This is necessary foruniqto work correctly.uniq -c: Collapses the sorted list, counting the number of consecutive identical lines (usernames) and prepending the count to each unique username.sort -nr: Sorts the resulting list numerically (-n) and in reverse (-r) order, placing the users with the most logins at the top.head -n 20: Displays only the top 20 entries from the sorted list.
You should see output similar to this:
1 reboot boot 6.5.0-28-generic Wed
1 rbailey tty2 Thu May
2 reboot boot 6.5.0-28-generic Fri
3 rbailey tty2 Sun May
1 rbailey tty2 Tue Apr
2 rbailey tty2 Fri May
2 rbailey tty2 Tue May
3 reboot boot 6.5.0-28-generic Sun
3 reboot boot 6.5.0-28-generic Tue
1 rbailey tty2 Wed May
1 reboot boot 6.5.0-28-generic ThuSo, in summary, the command sequence fetches the login session information, filters out blank lines, extracts the first column (presumably usernames or session IDs), sorts them in descending numerical order, and then counts the occurrences of each unique login session.
Set a console clock in the Terminal
This one-liner displays a continuously updating clock in the top-right corner of your terminal without disrupting your current command prompt position.
while sleep 1; do tput sc; DATE_STR=$(date); COL_POS=$(( $(tput cols) - ${#DATE_STR} - 1 )); tput cup 0 $COL_POS; echo -n "$DATE_STR"; tput rc; done &Command Explanation:
while sleep 1; do ... done &: This creates a loop that executes the contained commands every second (sleep 1) and runs the entire loop in the background (&).tput sc: Saves the current cursor position.DATE_STR=$(date): Stores the output of thedatecommand in a variable.COL_POS=$(( $(tput cols) - ${#DATE_STR} - 1 )): Calculates the correct starting column for the date string. It gets the terminal width (tput cols), subtracts the length of the date string (${#DATE_STR}), and subtracts 1 for padding.tput cup 0 $COL_POS: Moves the cursor to a specific position: row0(the top line) and the column calculated in the previous step.echo -n "$DATE_STR": Prints the date string without a trailing newline.tput rc: Restores the cursor position to where it was saved bytput sc.
List the Largest directories on your Computer
sudo du -h --max-depth=1 / | sort -hrLet’s break down the components of this command:
sudo: This command is used to execute subsequent commands with elevated privileges, often requiring administrator permissions.du -h --max-depth=1 /: Theducommand stands for “disk usage” and is used to estimate file and directory space usage. In this case:-hflag stands for “human-readable,” displaying file sizes in a format that is easier for humans to understand, such as KB, MB, GB, etc.--max-depth=1sets the maximum depth to 1, restricting the output to only the immediate directories and their sizes within the specified path, which is the root directory/.
|: This is the pipe operator, which takes the output of the command on its left and uses it as input for the command on its right. It allows chaining multiple commands together.sort -hr: This part of the command sorts the output received fromduin reverse numerical (-n) order and in a human-readable (-h) format. The flags used here are:-h: Sort human-readable numbers (e.g., 2K, 1G).-r: Reverse the result of comparisons, displaying the largest sizes first.
Example Output:
77G	/
46G	/home
11G	/snap
8.4G	/usr
8.3G	/var
2.6G	/installables
1014M	/opt
349M	/boot
15M	/etc
8.8M /tmpSo, when executed, this command essentially lists the sizes of directories within the root directory, displaying them in human-readable format and sorting them in descending order based on their sizes. This can be very helpful for identifying large directories and their sizes, aiding in disk space management and understanding where the storage is being utilized the most.
Get Important System Information
This awesome one-liner pulls out lots of important information about your local machine
echo -e "System Info:
- Hostname: $(hostname)
- Current User: $(whoami)
- CPU: $(grep 'model name' /proc/cpuinfo | uniq | sed 's/model name\s*:\s*//')
- RAM: $(free -h | awk '/^Mem/ {print $2}')
- Disks: $(lsblk | grep -c disk)
- Last Reboot: $(who -b | awk '{print $3, $4}')
- Power On Time: $(uptime -p)
- Current Date and Time: $(date '+%Y-%m-%d %H:%M:%S')
- OS: $(lsb_release -d | cut -f2-)"
Let’s break it down step by step:
echo -e: This command is used to print the following text, and the-eflag enables the interpretation of backslash escapes."System Info: ... OS: ": This is a string that serves as the header for the system information.$(hostname): Prints the current system’s hostname.$(whoami): Prints the username of the current user.$(grep 'model name' /proc/cpuinfo | uniq | sed 's/model name\s*:\s*//'): Retrieves the CPU model information by searching the/proc/cpuinfofile, then removes duplicate lines usinguniq, and finally usessedto remove the “model name” label.$(free -h | awk '/^Mem/ {print $2}'): Displays the total RAM by using thefreecommand to show memory usage in a human-readable format (-h), andawkis used to print the second column of the line starting with “Mem,” which represents the total memory.$(lsblk | grep -c disk): Counts the number of disks by listing block devices withlsblkand counting the lines containing the word “disk” usinggrep -c.$(who -b | awk '{print $3, $4}'): Shows the last reboot time by using thewhocommand with the-bflag to display the system boot time.awkis then used to print the third and fourth columns.$(uptime -p): Prints the system’s uptime in a human-readable format.$(date '+%Y-%m-%d %H:%M:%S'): Displays the current date and time in the specified format.$(lsb_release -d | cut -f2-): Retrieves the operating system description usinglsb_releaseand extracts the second field onwards usingcut.
You should see output like this:
System Info:
- Hostname: laptop-richard-bailey
- Current User: rbailey
- CPU: 12th Gen Intel(R) Core(TM) i7-1260P
- RAM: 31Gi
- Disks: 2
- Last Reboot: 2024-05-28 09:16
- Power On Time: up 3 days, 49 minutes
- Current Date and Time: 2024-05-31 10:05:18
- OS: Ubuntu 22.04.4 LTS
The entire command combines these components to produce a comprehensive system information summary with details about the hostname, current user, CPU, RAM, disks, last reboot, power-on time, current date and time, and the operating system.
Journalctl Command to Filter and Count Error Messages
journalctl is a utility in Linux systems for querying and displaying logs from the systemd journal. When managing virtual environments like VMware, it can be helpful to scan logs for error messages to identify potential issues. The command presented here searches for error-related entries in the systemd journal and counts how many times each executable generated an error message, all formatted neatly for analysis.
journalctl --no-pager --since today \
--grep 'fail|error|fatal' --output json|jq '._EXE' | \
sort | uniq -c | sort --numeric --reverse --key 1Command Explanation
journalctl --no-pager --since today --grep 'fail|error|fatal' --output json|jq '._EXE' | sort | uniq -c | sort --numeric --reverse --key 1:journalctl --no-pager --since today: Thejournalctlcommand fetches logs from the systemd journal. The--no-pagerflag prevents the output from being piped into a pager likeless. The--since todayparameter limits the search to logs generated since the beginning of the current day.--grep 'fail|error|fatal': This flag filters the logs to only include entries containing the terms “fail,” “error,” or “fatal.”--output json: Outputs the filtered logs in JSON format.jq '._EXE': Thejqcommand parses the JSON output to extract the value of the_EXEkey, which represents the executable that generated the log entry.sort: Sorts the extracted executable names.uniq -c: Counts the occurrences of each unique executable name.sort --numeric --reverse --key 1: Finally, sorts the count and executable name in descending order, making it easy to identify which executables are generating the most error messages.
Here is my example output:
     31 "/usr/lib/slack/slack"
     12 "/usr/bin/cat"
      7 "/snap/remmina/6419/usr/bin/remmina"
      2 "/usr/libexec/fprintd"
      2 null
      1 "/usr/libexec/gsd-color"
      1 "/usr/bin/gnome-shell"
1 "/snap/snapd/21759/usr/lib/snapd/snapd"Frequently Asked Questions (FAQ)
Q: Are these Linux one-liners safe to run?
A: The commands in this article are generally safe as they are primarily for reading system information. However, any command with sudo grants administrator privileges, and actions like find ... -delete are destructive and should be used with extreme caution. Always understand what a command does before executing it, especially as root.
Q: Will these commands work on macOS or a Windows (WSL) terminal?
A: Most of these commands use POSIX-standard utilities (awk, grep, sort, curl) and will work on macOS and WSL (Windows Subsystem for Linux). However, commands specific to systemd (systemctl, journalctl) and the Linux kernel’s /proc filesystem will not work on macOS, which has a different underlying architecture (BSD).
Q: How can I save a one-liner for later use?
A: The best way to save a command for frequent use is to create a shell alias. Open your shell’s configuration file (e.g., ~/.bashrc, ~/.zshrc) and add a line like: alias largest_dirs='sudo du -h --max-depth=1 / | sort -hr'. After reloading your shell, you can simply type largest_dirs to run the command.
Thanks for taking the time to read this article. if you have any questions or feedback, please write in the comment section below.
Leave a Reply