
TL;DR
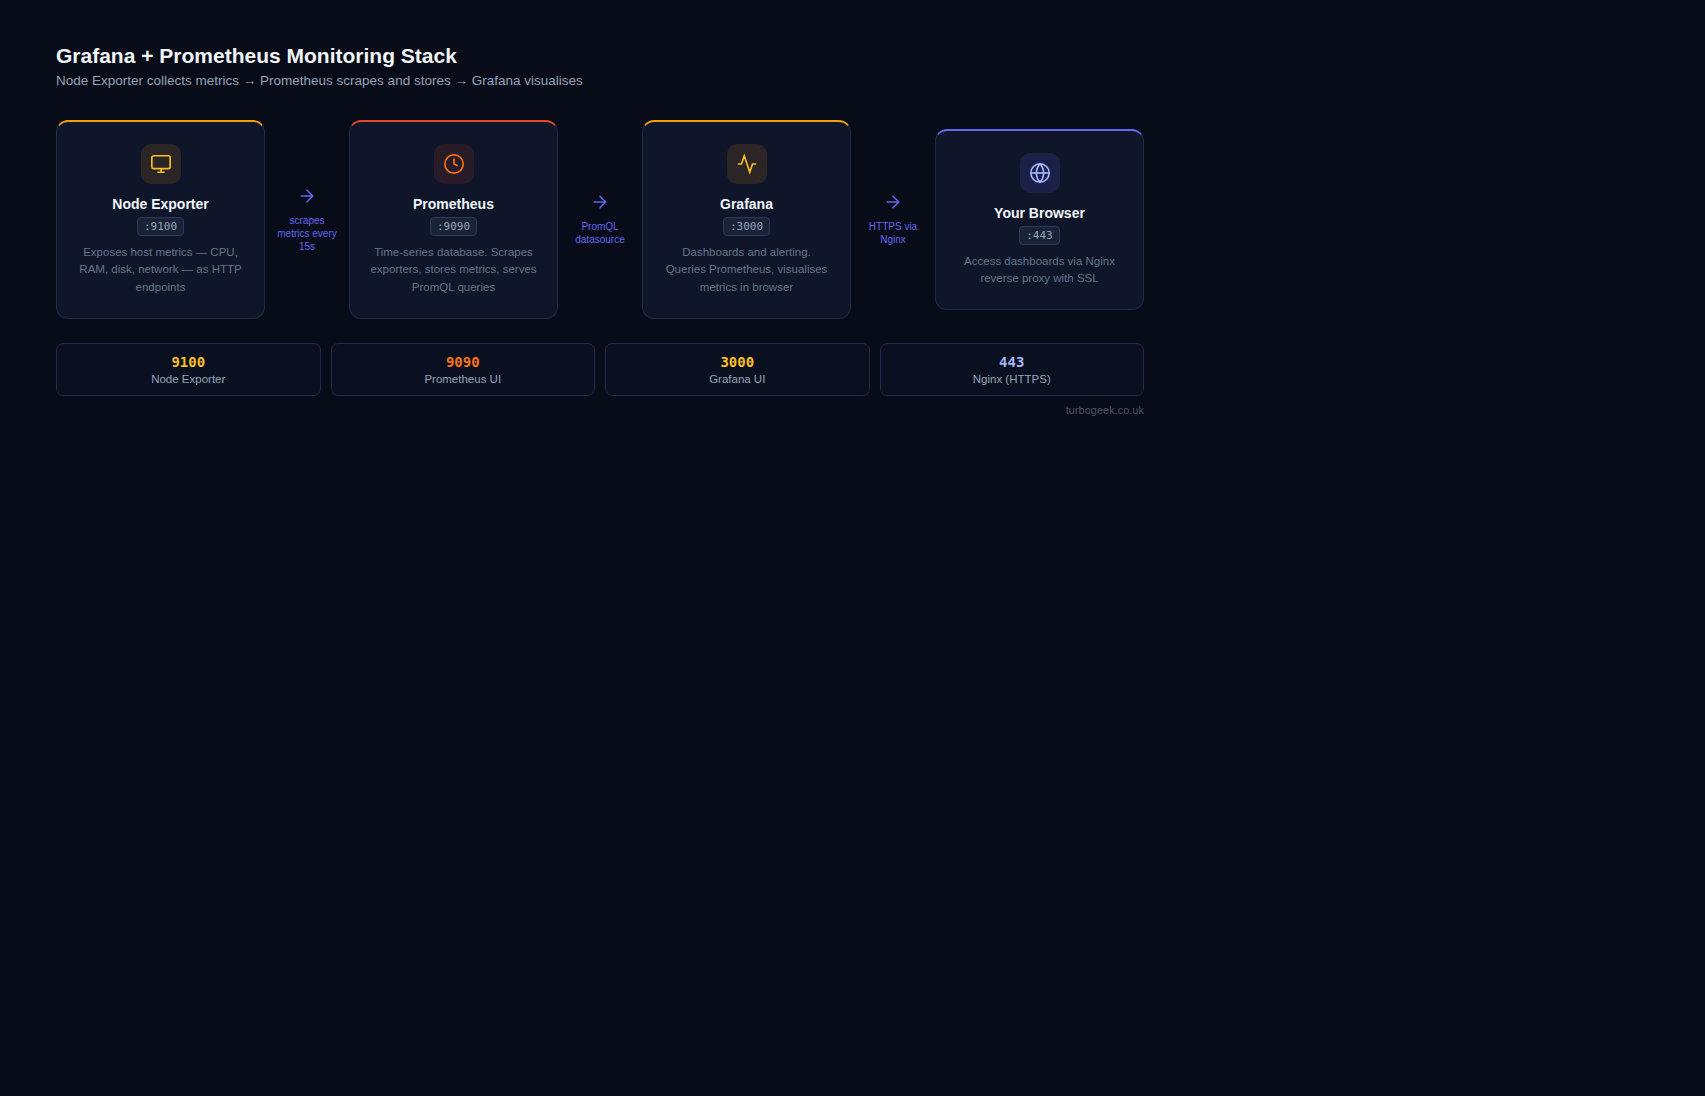
- Three pieces, one stack: Prometheus (metrics) + node_exporter (host metrics) + Grafana (dashboards).
- Add each project’s apt repo — distro packages lag too far for monitoring tooling.
- After install, point Grafana at
http://localhost:9090as the Prometheus data source. - Lock down: bind to localhost or behind nginx with TLS; never expose Grafana to the internet on its native port.
What is installing Grafana and Prometheus on Ubuntu 24.04?
Prometheus is a time-series database designed for monitoring; Grafana is a dashboard tool that queries it (and many other data sources) and presents the results visually. Together they’re the most widely-deployed open-source observability stack.
On Ubuntu 24.04 the right install path is each project’s official apt repository. Distro-shipped versions exist but lag months behind, missing features and security fixes. Both projects publish signed apt repos with stable release tracks.
Prerequisites
- Ubuntu 24.04 LTS server with sudo access.
- At least 2 GB RAM and 10 GB free disk for a small deployment.
- Open ports 9090 (Prometheus) and 3000 (Grafana) — at least on localhost.
How to use this guide
The sections below walk through the practical commands and options. After the main content you’ll find a Verification block (sanity-check it actually worked), a Troubleshooting block (common error messages and what to do), and Related reading for follow-on topics.
This guide provides a secure and efficient method for deploying a monitoring stack on Ubuntu 24.04. You will install Prometheus to collect metrics, Node Exporter to expose system metrics, Grafana to visualize the data, and Nginx as a secure reverse proxy for Grafana.
Part 1 — Install Grafana and Nginx Reverse Proxy
First, we will install Grafana from its official repository and configure Nginx to manage access to it.
- Install Dependencies and Grafana’s GPG Key:
sudo apt update
sudo apt install -y apt-transport-https software-properties-common wget gpg
wget -q -O - https://apt.grafana.com/gpg.key | gpg --dearmor | sudo tee /etc/apt/trusted.gpg.d/grafana.gpg > /dev/null- Add the Grafana Repository:
echo "deb [signed-by=/etc/apt/trusted.gpg.d/grafana.gpg] https://apt.grafana.com/oss/deb stable main" | sudo tee /etc/apt/sources.list.d/grafana.list- Install and Start Grafana:
sudo apt update
sudo apt install -y grafana
sudo systemctl start grafana-server
sudo systemctl enable grafana-server- Install and Configure Nginx: Install Nginx, which will act as a reverse proxy.
sudo apt install -y nginx - Create a new Nginx configuration file for Grafana
.
sudo nano /etc/nginx/sites-available/grafana- Paste the following configuration. Replace
your_domain.comwith your server’s actual domain name or IP address.
server {
    listen 80;
    server_name your_domain.com;

    location / {
        proxy_pass http://localhost:3000;
        proxy_set_header Host $http_host;
        proxy_set_header X-Real-IP $remote_addr;
        proxy_set_header X-Forwarded-For $proxy_add_x_forwarded_for;
        proxy_set_header X-Forwarded-Proto $scheme;
    }
}- Enable the new site by creating a symbolic link and restart Nginx.
sudo ln -s /etc/nginx/sites-available/grafana /etc/nginx/sites-enabled/
sudo nginx -t  # Test the configuration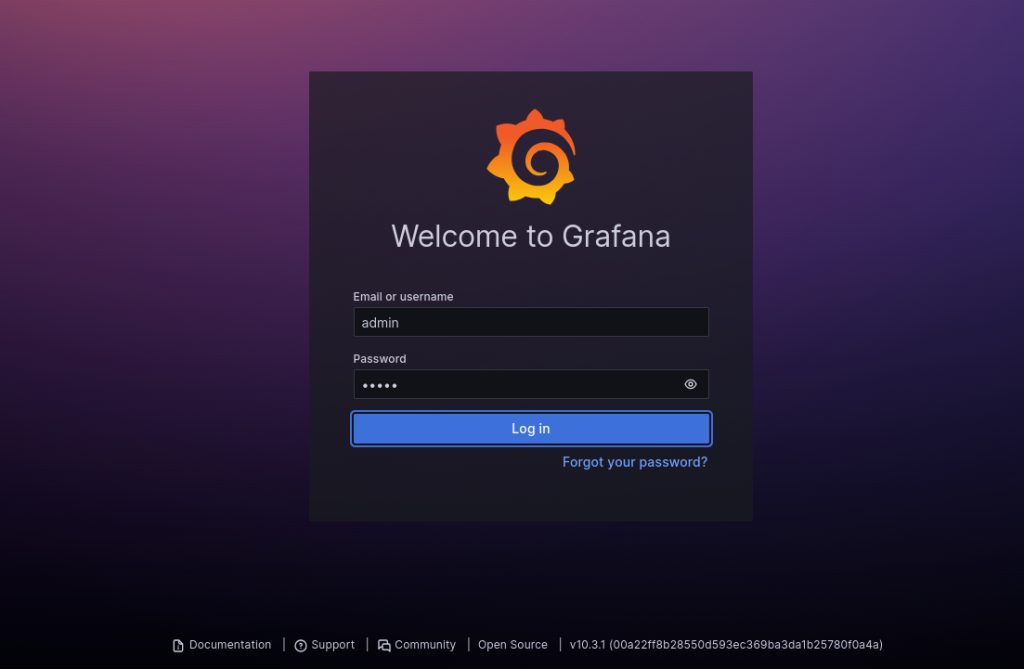
sudo systemctl restart nginx- You should now be able to access the Grafana login page at
http://your_domain.com. Log in with the default credentialsadmin/adminand change the password immediately.
Part 2 — Install and Configure Prometheus
Next, we will manually install and configure Prometheus.
- Create Prometheus User and Directories:
sudo groupadd --system prometheus
sudo useradd -s /sbin/nologin --system -g prometheus prometheus
sudo mkdir -p /etc/prometheus /var/lib/prometheus- Download and Install Prometheus: Navigate to the official Prometheus downloads page and copy the link for the latest
linux-amd64binary.
# Replace the URL with the link you copied
PROMETHEUS_URL="https://github.com/prometheus/prometheus/releases/download/v3.10.0/prometheus-3.10.0.linux-amd64.tar.gz"

cd /tmp
wget ${PROMETHEUS_URL}
tar xvf prometheus-*.linux-amd64.tar.gz
cd prometheus-*.linux-amd64/

sudo mv prometheus promtool /usr/local/bin/
sudo mv prometheus.yml /etc/prometheus/prometheus.yml- Set Ownership and Permissions:
sudo chown prometheus:prometheus /usr/local/bin/prometheus /usr/local/bin/promtool
sudo chown -R prometheus:prometheus /etc/prometheus /var/lib/prometheus
sudo chmod -R 755 /etc/prometheus /var/lib/prometheus- Create the Prometheus Systemd Service:
sudo nano /etc/systemd/system/prometheus.service - Paste in the following service definition.
[Unit]
Description=Prometheus Time Series Collection and Processing Server
Wants=network-online.target
After=network-online.target

[Service]
User=prometheus
Group=prometheus
Type=simple
ExecStart=/usr/local/bin/prometheus \
    --config.file /etc/prometheus/prometheus.yml \
    --storage.tsdb.path /var/lib/prometheus/ \
    --web.listen-address=0.0.0.0:9090

[Install]
WantedBy=multi-user.target
Now start and enable the prometheus service
systemctl start prometheus.service
systemctl enable prometheus.service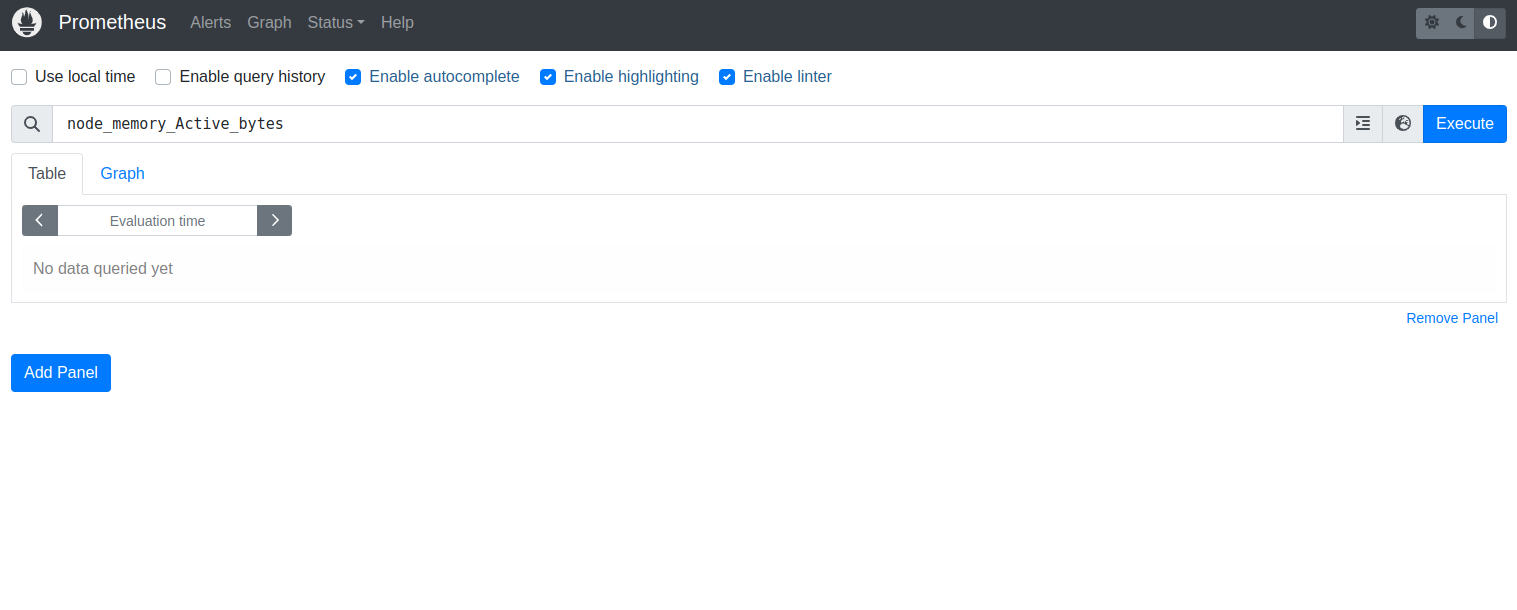
Part 3 — Install and Configure Node Exporter
Node Exporter exposes hardware and OS metrics from your server.
- Create Node Exporter User:
sudo useradd -s /sbin/nologin --system node_exporter- Download and Install Node Exporter: Get the latest
linux-amd64download link from the Prometheus downloads page
# Replace the URL with the link you copied
NODE_EXPORTER_URL="https://github.com/prometheus/node_exporter/releases/download/v1.10.2/node_exporter-1.10.2.linux-amd64.tar.gz"

cd /tmp
wget ${NODE_EXPORTER_URL}
tar xvf node_exporter-*.linux-amd64.tar.gz
cd node_exporter-*.linux-amd64/

sudo mv node_exporter /usr/local/bin/
sudo chown node_exporter:node_exporter /usr/local/bin/node_exporter- Create the Node Exporter Systemd Service:
sudo nano /etc/systemd/system/node_exporter.service
[Unit]
Description=Prometheus Node Exporter
Wants=network-online.target
After=network-online.target

[Service]
User=node_exporter
Group=node_exporter
Type=simple
ExecStart=/usr/local/bin/node_exporter

[Install]
WantedBy=multi-user.target- Start and enable the service.
sudo systemctl daemon-reload
sudo systemctl start node_exporter
sudo systemctl enable node_exporter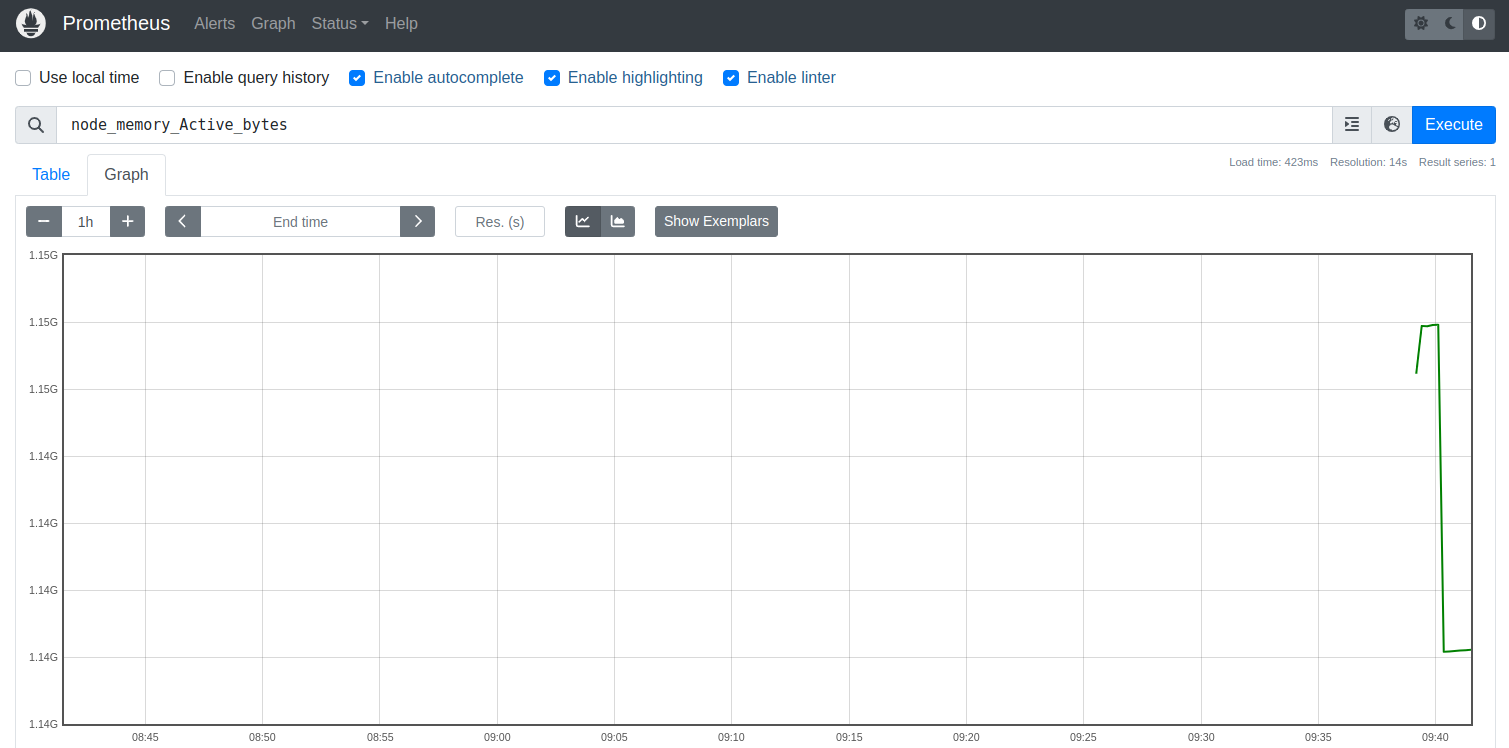
Part 4 — Connect Node Exporter and Grafana
Finally, tell Prometheus to scrape metrics from Node Exporter, and then add Prometheus as a data source in Grafana.
- Add Node Exporter to Prometheus Scrape Config: Edit the Prometheus configuration file.
sudo nano /etc/prometheus/prometheus.yml - At the end of the
scrape_configs:section, add the following job. Uselocalhostas the target since it’s running on the same machine.YAML
# A scrape configuration containing exactly one endpoint to scrape:
# Here it's Prometheus itself.
scrape_configs:
  - job_name: "prometheus"
    static_configs:
      - targets: ["localhost:9090"]

  - job_name: "node_exporter"
    static_configs:
- targets: ["localhost:9100"]- Restart Prometheus to apply the new configuration.
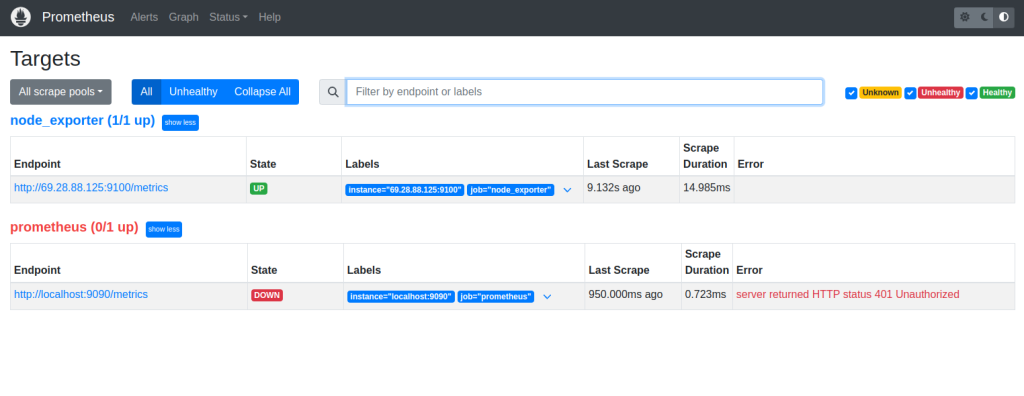
sudo systemctl restart prometheus - You can visit
http://your_domain.com:9090and check the “Status” -> “Targets” page to confirm both targets are UP. - Add Prometheus as a Grafana Data Source:
- Log in to your Grafana instance (
http://your_domain.com). - Navigate to Connections > Data sources.
- Click Add new data source and select Prometheus.
- In the Prometheus server URL field, enter
http://localhost:9090. - Click Save & test. You should see a “Data source is working” message.
- Log in to your Grafana instance (
You can now navigate to “Dashboards” and import a pre-built dashboard, such as the “Node Exporter Full” dashboard (ID: 1860), to instantly visualize your server’s metrics.
Want to learn how to create a Grafana TIG stack – click here
Want to know how to secure Grafana SSL/TLS certificates – click here
Verification
Sanity-check the change actually worked:
systemctl status prometheus grafana-server node_exporter— all three active.curl http://localhost:9090/-/ready— Prometheus reports ready.- Browse
http://localhost:3000— Grafana login page loads.
Troubleshooting
Grafana data source test fails — Confirm Prometheus is bound to a reachable interface; ss -tlnp | grep 9090 shows the bind.
node_exporter scrape returns empty — Service running but Prometheus config not pointing at it. cat /etc/prometheus/prometheus.yml — confirm job_name: 'node' with the correct target.
Grafana behind reverse proxy can’t sign in — Set root_url in /etc/grafana/grafana.ini to the external URL; restart grafana-server.
Authoritative sources
References: Prometheus install docs, Grafana install docs.
Leave a Reply