
This guide acts as the Glances install hub for TurboGeek.
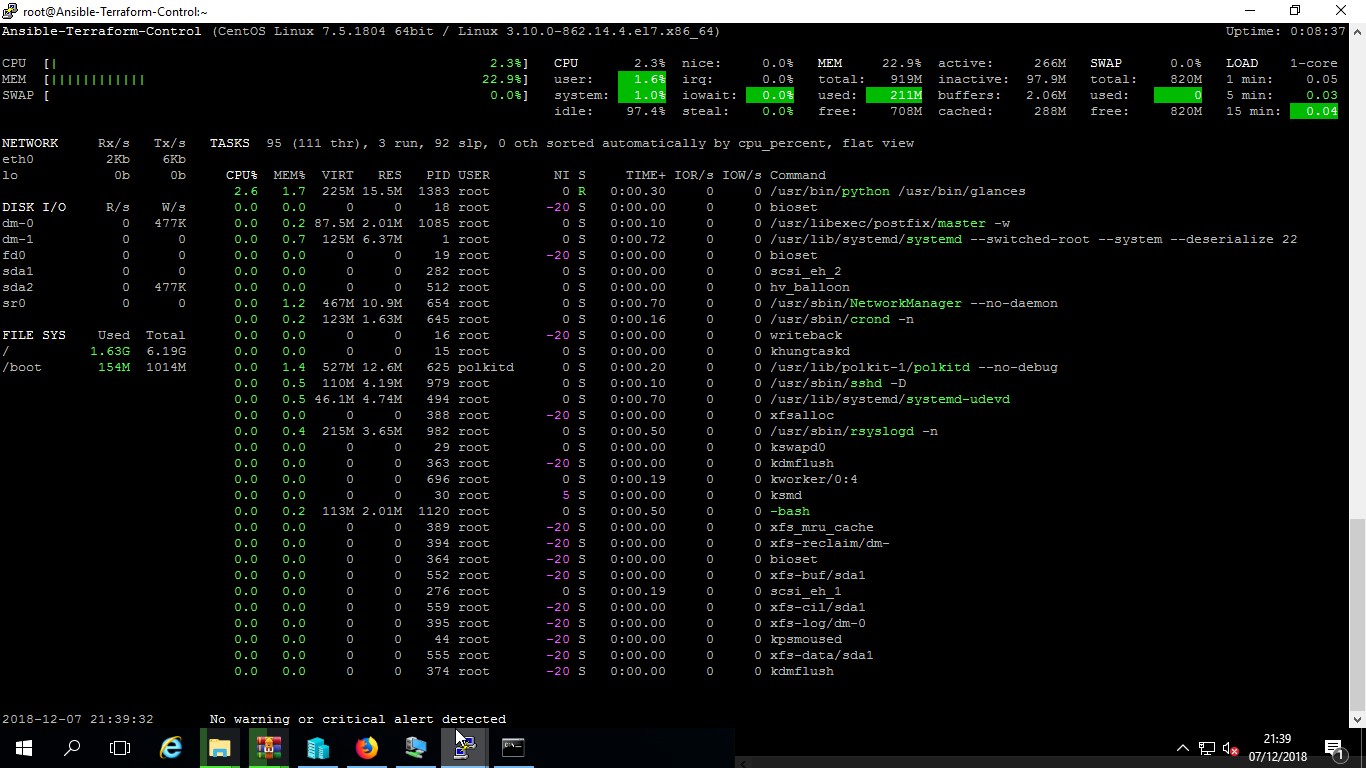
Glances is a Python-based system monitoring tool that gives you a real-time dashboard for CPU, memory, disk I/O, network activity, processes, sensors, containers, and more. It can run in a local terminal, in a browser, or in client/server mode.
TL;DR
- Use this page as the hub, then jump to the distro-specific Glances guide.
- Use distro packages for simplicity and
pipxor a virtual environment when you need the latest stable release. - Protect the web interface with a password before exposing port
61208.
Source check – May 10, 2026: The Glances install documentation says PyPI provides the latest stable version,
pip install glancesis the simple install path, andpip install glances[all]enables optional features. The Docker documentation documents password protection for server and web-server modes.
| Method | Best for | Trade-off |
|---|---|---|
| Package manager | Simple, distro-native installs | Version may trail the latest Glances release |
pipx or venv | Latest stable Glances with cleaner isolation | Requires Python tooling |
| Docker | Container hosts and dashboards | Needs careful socket, host, and password handling |
Start here: If you already know your platform, jump straight to the matching guide below. If you are building a larger monitoring stack, pair Glances with the Grafana and Prometheus guide.
Choose the right Glances install guide
- How to Install Glances on Ubuntu
- How to Install Glances on RHEL 9/8, Rocky Linux and AlmaLinux
- How to Install Glances on CentOS Stream
- How to Install Glances on Legacy RHEL and CentOS (5, 6, 7)
Why Glances is useful
- It combines the most useful parts of
top,htop, disk, process, and network monitoring in one screen. - It highlights pressure points with color-coded alerts.
- It can expose a built-in web interface for remote checks.
- It supports export and integration options for larger monitoring workflows.
Quick start after installation
Once Glances is installed, the basic commands are the same across distributions:
glancesstarts the interactive terminal UI.glances --versionconfirms the installed version.glances -wstarts the built-in web UI.
The default web interface listens on port 61208. Open that port only when you understand the network path, authentication, and firewall rules protecting it.
When should you avoid this hub page?
This page is the overview. If you need exact commands, troubleshooting, or version-specific package names, use the distro-specific guides above rather than relying on a generic Linux walkthrough.
Leave a Reply