
Enhancing Cloud Monitoring with Google Cloud Stackdriver: An Up-to-Date Overview
Note: In 2023, Google renamed Stack Driver to Google Operations.
Monitoring and managing resources efficiently ensures seamless operations and delivers a top-notch user experience. Google Cloud Stackdriver offers comprehensive metrics and analytics for both Google Cloud Platform (GCP) and Amazon Web Services (AWS).
This article presents an updated overview of Stackdriver, highlighting its key features, integrations with third-party tools, and essential best practices to optimize monitoring capabilities.
Google Operations (StackDrivers) Key Features
- Monitoring: Collects metrics, events, and metadata from Google Cloud Platform resources, AWS resources, and various applications. It provides dashboards and alerts to help you track the health and performance of your systems.
- Logging: Provides real-time log management and analysis capabilities. You can store, search, analyze, monitor, and alert on log data and events.
- Error Reporting: Aggregates and displays errors produced by your applications, allowing you to identify and troubleshoot issues quickly.
- Tracing: Helps you understand how requests propagate through your applications by analyzing latency data. This helps identify performance bottlenecks and optimize your applications.
- Debugger: Enables you to inspect the state of your running applications without stopping or slowing them down. This can be extremely helpful in diagnosing production issues.
- Profiler: Provides continuous profiling of resource consumption in your production applications, helping you identify and eliminate performance bottlenecks.
StackDriver Unified Monitoring for GCP:
Google Cloud Stackdriver acts as a unified monitoring platform. Since being bought out by Google, Stackdrive now only supports GCP (once upon a time, it worked really well with AWS environments); this “single pane of glass” approach allows users to streamline monitoring across multiple projects, creating a centralized view of performance metrics and warnings. By linking all projects to a single account, teams gain better visibility and can effectively manage their cloud resources.
Seamless Integration with Third-Party Tools:
Stackdriver’s versatility extends beyond native Google products. It integrates seamlessly with popular third-party tools such as Slack, Splunk, and PagerDuty, enabling teams to receive real-time alerts and notifications based on monitoring data. This enhances collaboration and improves upon the escalation of issues for urgent resolution.
Comprehensive Stackdriver Monitoring Capabilities:
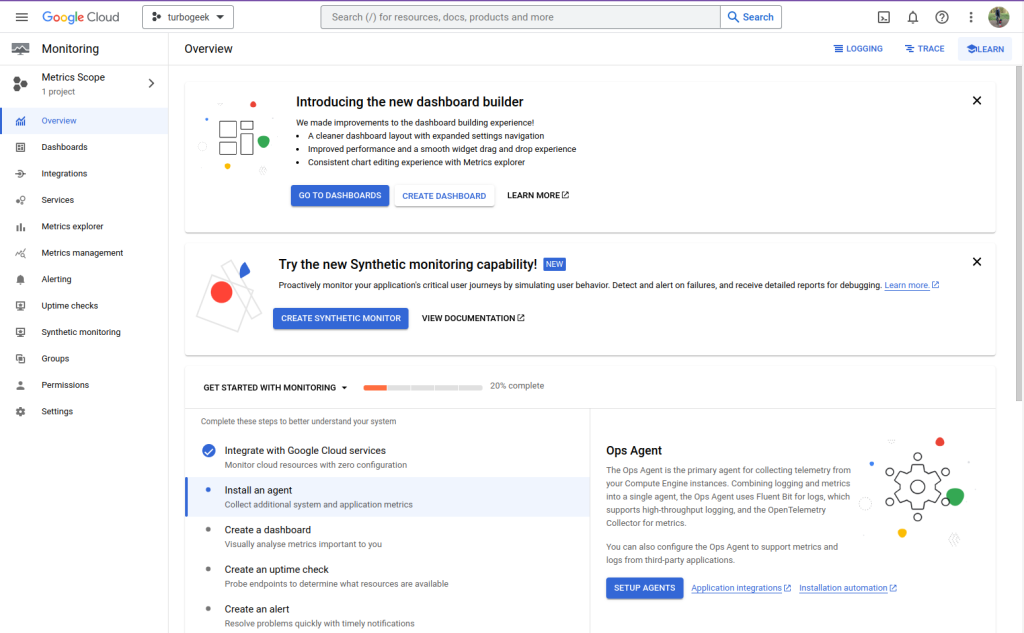
Stackdriver provides a wide range of monitoring capabilities, including health checks, ping checks, uptime reports, and latency reports. For native Google products like App Engine and Kubernetes Engine, metrics are automatically configured, while other instances require the agent to monitor integration.
Maximizing Monitoring Efficiency:
Enabling logging is essential to utilize Stackdriver’s potential fully. This unlocks Google’s support services and enables powerful monitoring features, such as grouping instances for collective monitoring, such as total web server monitoring. Properly segregating production and development Stackdriver logging facilitates a comprehensive overview of infrastructure performance.
Data Retention and Export Options:
Stackdriver offers flexibility in data retention. The free version retains logs for 7 days, while the paid version extends this to 30 days. Users can export logs to Cloud Storage, BigQuery, or Cloud Pub/Sub to preserve log data beyond this period. Additionally, visualizing data is made effortless through integration with Cloud DataLab.
Automated Error Reporting:
Google Cloud Stack driver automatically provides error reporting by identifying known errors within the stack. These errors are promptly routed to the error reporting tab, facilitating proactive monitoring and prompt issue resolution.
Advantages of StackDriver
Comprehensive Monitoring:
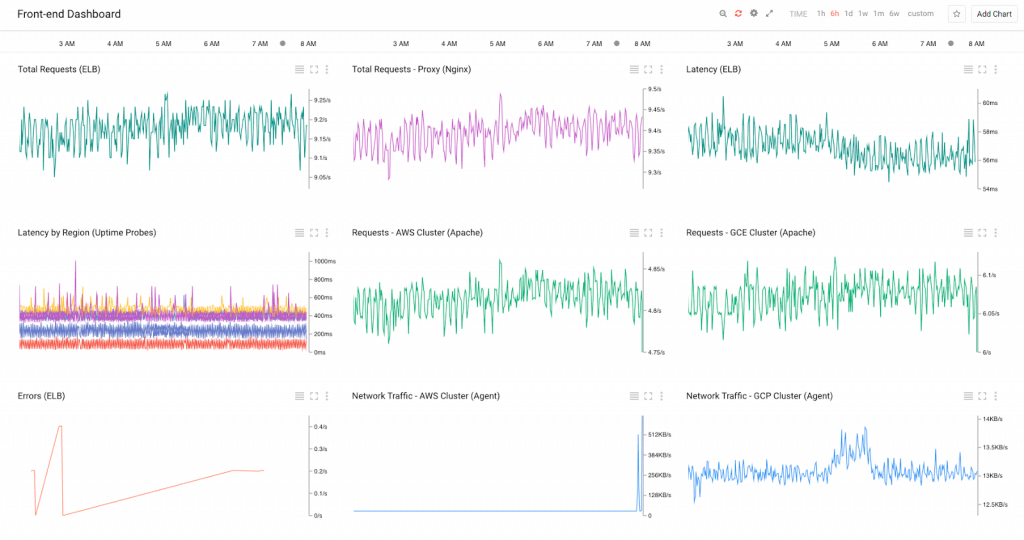
Stackdriver offers a wide range of monitoring capabilities across various GCP services, including virtual machines, databases, Kubernetes clusters, and more. It provides insights into metrics like CPU usage, memory, disk I/O, network traffic, and application performance.
Unified Platform:
It consolidates monitoring data from different sources into a single platform, making it easier to visualize, analyze, and correlate metrics across various services.
Integrated Logging:
Stackdriver integrates with Cloud Logging, allowing you to collect and analyze logs from your GCP resources. This is valuable for troubleshooting and understanding your applications’ behavior.
Alerting and Incident Management:
It enables you to set up alerts based on predefined thresholds or custom conditions. When an issue arises, Stackdriver can trigger notifications through email, SMS, or other channels.
Ease of Use:
Stackdriver is relatively easy to set up and configure, especially if you are already using other GCP services. It has a user-friendly interface and intuitive dashboards.
Scalability:
It is designed to scale with your GCP resources. You can monitor thousands of instances and collect vast amounts of data without worrying about performance issues.
Disadvantages of StackDriver
Cost:
Stackdriver is not free. While it offers a free tier with limited features, the cost can increase significantly as your usage grows. You need to consider the pricing model and potential costs carefully.
Learning Curve:
While the basic setup is straightforward, utilizing Stackdriver’s full potential can require some learning and understanding of its features and configurations.
Complexity for Large Environments:
Managing and configuring Stackdriver effectively can become challenging in very large and complex GCP environments.
Limited Third-Party Integrations:
Stackdriver is primarily focused on GCP resources. While it offers some integrations with third-party tools, the options are limited compared to other monitoring solutions.
Alternatives to StackDriver
There are several alternatives to Google Cloud Operations Suite (formerly Stackdriver) that offer similar monitoring and observability capabilities for your cloud infrastructure:
Popular Alternatives:
- Dynatrace:
Provides comprehensive full-stack monitoring with AI-powered insights and automated root cause analysis. - Datadog:
Offers infrastructure monitoring, application performance monitoring (APM), log management, and more, with a user-friendly interface and extensive integrations. - New Relic:
Focuses on APM and digital experience monitoring, providing insights into application performance, user experience, and customer journeys. - Prometheus:
An open-source monitoring and alerting toolkit designed for reliability and scalability. Often used in conjunction with Grafana for visualization. - Grafana:
An open-source visualization and analytics platform that works well with various data sources, including Prometheus and Stackdriver.
Other Notable Alternatives:
- Amazon CloudWatch:
AWS’s native monitoring and observability service is tightly integrated with other AWS services. - Azure Monitor:
Microsoft’s monitoring solution for Azure resources and applications. - Sumo Logic:
A cloud-native machine data analytics platform for log management and security analytics.
The best alternative for you will depend on your specific needs and requirements. Consider factors such as:
- Supported platforms:
Ensure the alternative supports your cloud provider (GCP, AWS, Azure) and technologies (e.g., Kubernetes, serverless). - Features:
Look for features like metrics collection, log management, tracing, alerting, and integrations with your existing tools. - Ease of use:
Choose a solution with a user-friendly interface and intuitive workflows. - Scalability:
If you expect your infrastructure to grow, make sure the alternative can scale to meet your needs. - Cost:
Compare pricing models to find a solution that fits your budget.
I recommend exploring the features and free trials of different alternatives to see which best suits your requirements.
Google Cloud Stackdriver monitors cloud infrastructure and applications, providing metrics, integrations, and error reporting to help businesses manage cloud resources effectively.
This is just a very quick overview of Google Operations (aka Stackdriver). For more on GCP, check out our other articles.
Leave a Reply