
I had to share this awesome script I found on GitHub about vCenter visio.
But first, all credit goes to:
File Name	: vDiagram_2.0.8.ps1
Author		: Tony Gonzalez
Author		: Jason Hopkins
Based on	: vDiagram by Alan Renouf
Version : 2.0.8vDiagram 2.0: A Comprehensive vCenter Visio Procedure
Introduction
vDiagram 2.0 is a GitHub repository that provides a PowerShell script designed to capture and visualize a VMware infrastructure in Microsoft Visio (vCenter visio). The project is an extension of Alan Renouf’s original vDiagram and is currently maintained by Tony Gonzalez and Jason Hopkins. The script is particularly useful for administrators who need to document their VMware setups in a visual format.
Before You Start vCenter Visio
- PowerShell: Download and install the Windows Management Framework 5.1 from here.
- PowerCLI Modules: Open PowerShell and run the command
Install-Module -Name VMware.PowerCLI –Scope CurrentUser- Microsoft Visio: Ensure that Microsoft Visio is installed on your system.
Auto-Generate vCenter Visio Diagrams: A Step-by-Step Guide
Prerequisites:
- vCenter Server: Ensure you have access to a vCenter Server instance with the necessary permissions.
- Visio: Install Microsoft Visio on your machine. (The script may require a specific version; check the documentation.)
- vDiagram Script: Download and unzip the latest vDiagram PowerShell script files to a suitable location on your computer. (Note the location for later use.)
Step 1 – Launch PowerShell as Administrator for vCenter Visio
- Click the Windows Start button.
- Type “PowerShell” in the search bar.
- Right-click on “Windows PowerShell” and select Run as administrator.
Step 2 – Navigate to the Script Directory:
In the PowerShell window, use the cd (change directory) command to navigate to the folder where you unzipped the vDiagram vCenter Visio files.
For example, if you extracted the files to your Downloads folder, you might type:PowerShell
cd c:\Users\<your user name>\Downloads\vDiagram_2.0.X. (Replace <your user name> with your actual Windows username.)
Step 3 – Execute the Script for vCenter Visio:
Type the full name of the PowerShell script, followed by .ps1 (e.g., vDiagram_2.0.X.ps1) and press Enter. This will initiate the script execution.
Step 4 – Follow the Interactive Prompts:
The script will guide you through a series of questions:
- vCenter Server Connection: Provide the hostname or IP address of your vCenter Server.
- Credentials: Enter your vCenter username and password.
- Diagram Options: Select the type of Visio diagram you want to generate (e.g., network topology, virtual machine inventory).
- Customization (Optional): Depending on the script version, you might be able to customize the diagram layout, object details, or other aspects.
Step 5 – Generate Your Diagram:
Once you’ve answered the prompts, the script will connect to your vCenter Server, gather the necessary information, and automatically create your Visio diagram.
Step 6 – Review and Save:
Open the generated Visio file to review the diagram. Make any necessary adjustments or edits.
Save the diagram to your desired location.
Usage Notes
- Unblock File: Ensure to unblock the downloaded file before unzipping it.
- Run as Administrator: Execute the script with administrative privileges.
- Required Files: Make sure you have PowerCLI or PowerShell 5.0 with PowerCLI Modules installed, an active connection to vCenter, and MS Visio installed.
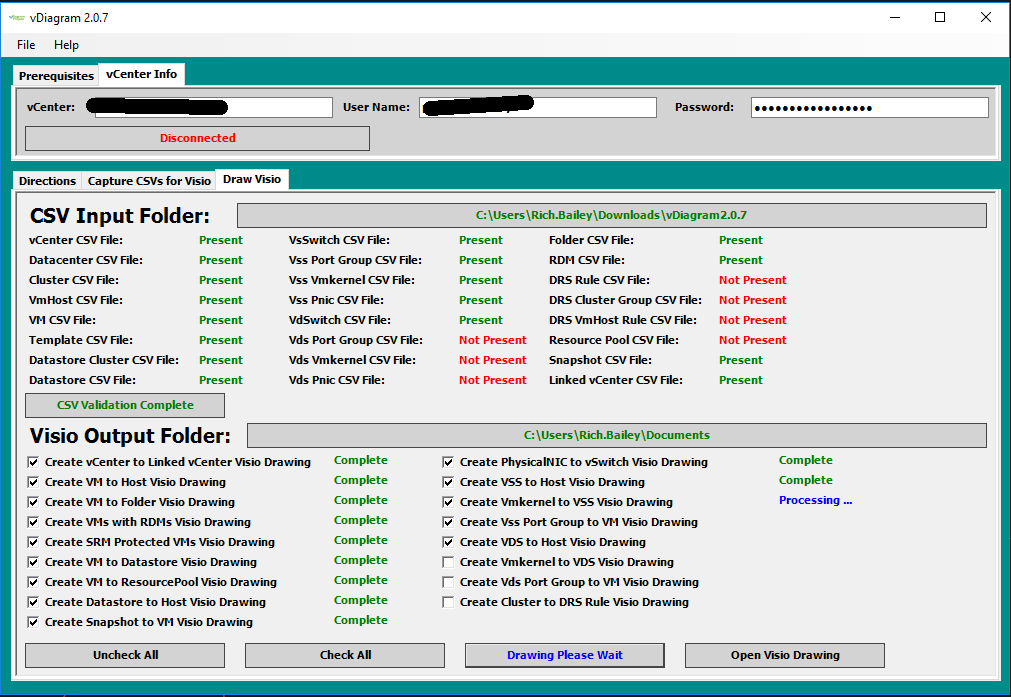
Tabs in the Script
- Prerequisites Tab: Verify that all prerequisites are met.
- vCenter Info Tab: Enter the name of your vCenter and login credentials.
- Capture CSVs for Visio Tab: Select the items you wish to capture data on and specify the output folder.
- Draw Visio Tab: Validate the presence of required files, select the drawing you’d like to produce, and specify the output folder.
Execution Steps
- Connect to vCenter: Click on the “Connect to vCenter” button after entering your vCenter information.
- Collect CSV Data: Click on this button to start capturing data.
- Draw Visio: Click on this button to start drawing the Visio diagram.
- Open Visio Drawing: Click on this button once the drawing is complete to open the Visio file.
Change Log
The script has undergone several updates, including the addition of new features and bug fixes. The most recent update, v2.0.12, added the option to choose between vDiagram Visio Shapes and VMware Validated Design Shapes.
vDiagram 2.0 offers a robust solution for capturing and visualizing VMware infrastructures. By following this detailed procedure, you can efficiently utilize this tool to create comprehensive Visio diagrams of your VMware setup.
Alternatives to vDiagram 2.0 for VMware Infrastructure Visualization
RVTools
RVTools is a Windows .NET 4.6.1 application that uses the VI SDK to display information about your virtual environments. It provides a tabular view of various components of your VMware infrastructure, such as vCPU, memory, data stores, and more. While it doesn’t offer Visio integration, it does allow for exporting data to Excel, CSV, and HTML formats.
Lucidchart
Lucidchart is an online diagramming tool that offers various templates for network diagrams, including those for VMware infrastructures. It provides real-time collaboration but lacks the automated data collection feature that vDiagram offers. You would need to manually input or import your VMware data.
NetZoom
NetZoom focuses on data center design and documentation and offers Visio stencils for various hardware components from multiple vendors, including VMware. It’s more comprehensive but also more complex compared to vDiagram. It’s suitable for larger enterprises that require detailed data center documentation.
SolarWinds Virtualization Manager
This tool provides comprehensive visualization and analytics for VMware as well as Hyper-V environments. It offers various views, including a “Sprawl” view to identify wasted resources. While it doesn’t export to Visio, it does offer robust reporting features.
Veeam ONE
Veeam ONE provides deep, intelligent monitoring and reporting for vSphere and Hyper-V environments. It offers customizable dashboards, but like SolarWinds, it doesn’t have Visio export capabilities. It’s more focused on real-time monitoring and analytics rather than documentation.
Conclusion
While vDiagram 2.0 offers the unique advantage of automated Visio diagram creation based on real-time VMware infrastructure data, there are several other tools in the market that offer different strengths. Your choice would depend on your specific needs—whether it’s real-time monitoring, detailed analytics, or collaborative diagramming.
Leave a Reply