
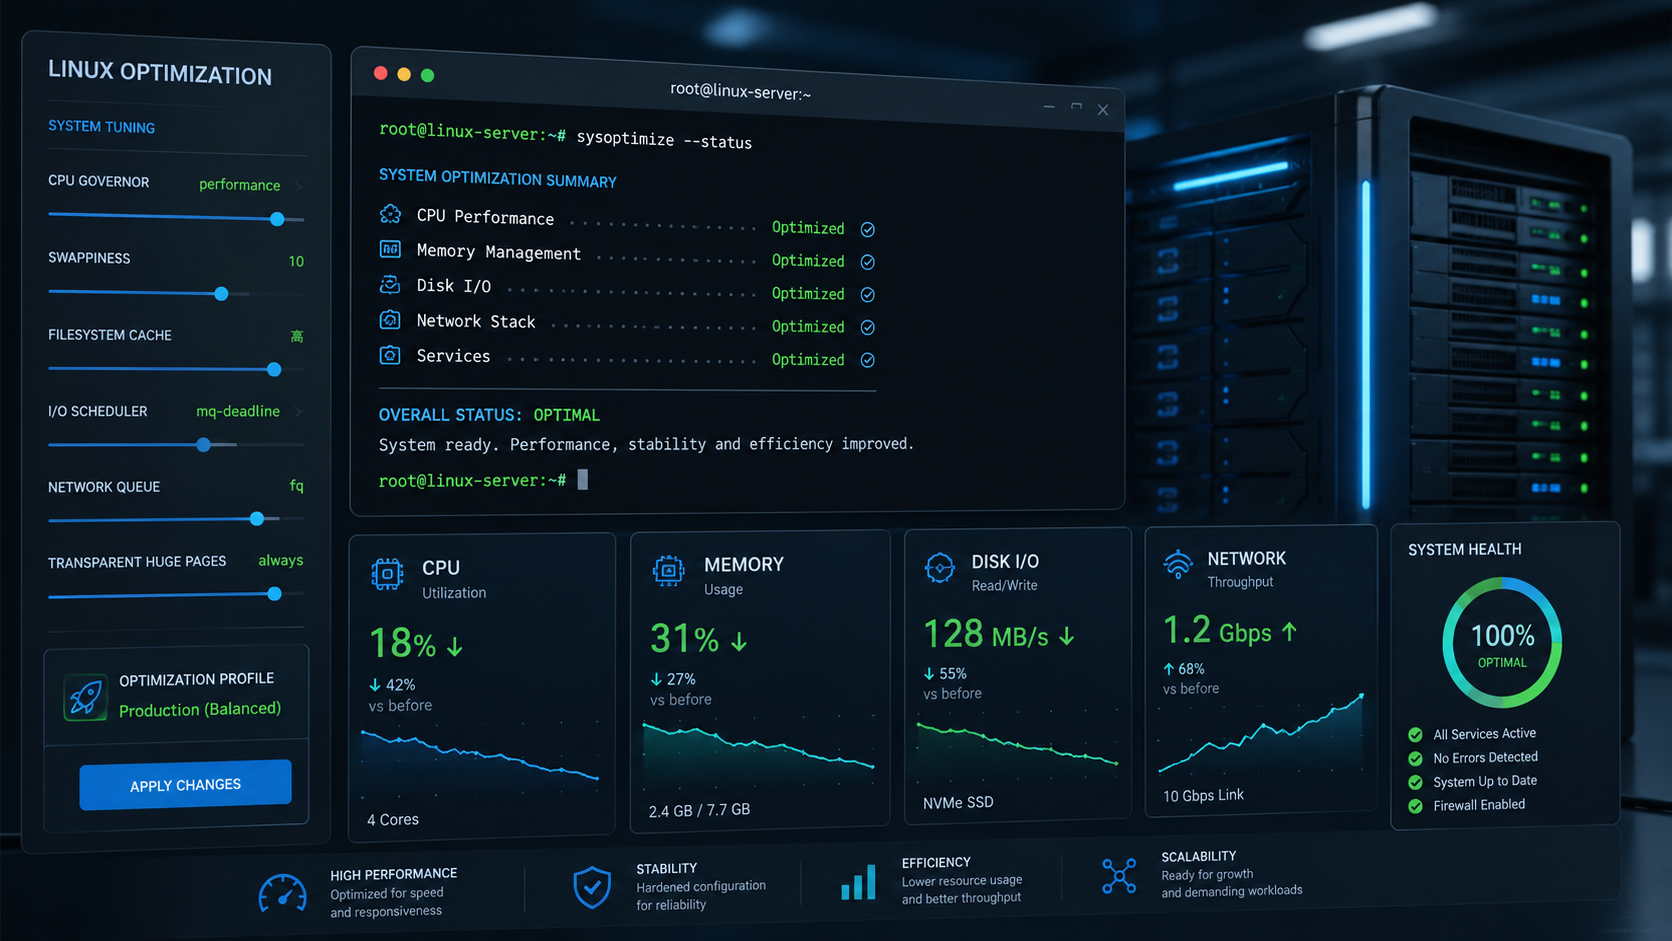
Linux performance optimization is not about applying random tuning commands from the internet. It is about finding the real bottleneck, changing the right thing, and proving that the change helped.
A slow Linux system usually has one main constraint: CPU, memory, disk I/O, network, application behavior, or an overloaded service. The job is to identify which one it is before you start changing kernel parameters, disabling services, or resizing infrastructure.
The golden rule is simple: measure first, change one thing, measure again.
TL;DR
- Start with evidence, not guesses.
- Use
top,htop,free,vmstat,iostat,sar,ss, andpidstatto find the bottleneck. - Check CPU, memory, disk, network, and service behavior separately.
- Do not blindly change
sysctlvalues, swappiness, I/O schedulers, or network buffers. - Keep the system patched, but schedule updates properly on production servers.
- Disable unnecessary services with
systemctl, not old init scripts. - Use
perfwhen basic tools show high CPU usage but not the reason. - Validate every change with before-and-after metrics.
What Does Linux Performance Optimization Mean?
Linux performance optimization means improving how efficiently a Linux system uses CPU, memory, storage, network, and application resources.
That could mean:
- Finding a process consuming too much CPU.
- Fixing a memory leak.
- Reducing disk I/O wait.
- Tuning a database workload.
- Removing unnecessary services.
- Choosing a better I/O scheduler.
- Improving network throughput.
- Updating packages with performance or security fixes.
- Moving a workload to better-sized infrastructure.
Good optimization starts with observability. Brendan Gregg’s Linux performance guidance strongly favors structured analysis, profiling, tracing, and measurement before tuning. His USE method checks utilization, saturation, and errors across resources so you do not miss an obvious bottleneck.
Prerequisites
Before you start, make sure you have:
- Root or
sudoaccess. - A reproducible workload or clear symptom.
- A maintenance window for risky changes.
- A backup or rollback plan.
- Baseline metrics before changing anything.
Install the core tools:
# Ubuntu / Debian
sudo apt update
sudo apt install -y htop iotop sysstat dstat glances linux-tools-common

# RHEL / Rocky / Alma
sudo dnf install -y htop iotop sysstat glances perf

# Fedora
sudo dnf install -y htop iotop sysstat glances perf
The sysstat package provides tools such as sar, iostat, mpstat, and pidstat. These are useful because they show historical and live system activity rather than only a single point-in-time view.
Step 1: Establish a Baseline
Never optimize a system until you know what normal looks like.
Start with:
uptime
free -h
df -h
top
vmstat 1 10
iostat -xz 1 10
sar -u 1 5
The first questions to answer are:
- Is the system CPU-bound?
- Is it running out of usable memory?
- Is it swapping?
- Is disk I/O saturated?
- Is network throughput or packet loss the issue?
- Is one process causing the problem?
- Did the issue begin after a deployment, a package update, a traffic spike, or a configuration change?
The free command shows total, used, free, shared, buffer/cache, and available memory. The available column is usually more useful than the free column because Linux deliberately uses spare memory for cache.
Step 2: Check CPU Usage
Start with top or htop:
top
Press 1 inside top to show per-core CPU usage. This matters because a system can look fine overall while one CPU core is pinned at 100%.
Look for:
- High
%usfor user-space CPU usage. - High
%syfor kernel CPU usage. - High
%wafor I/O wait. - A single process consuming a full core.
- Load average higher than the number of CPU cores.
For a better per-process view:
pidstat -u 1
To check CPU usage per core:
mpstat -P ALL 1
High CPU is not always a problem. A batch job, compiler, video encoder, or data processing task may be expected to use all available CPU. It becomes a problem when user-facing latency increases, queue depth grows, or important processes are waiting too long to run.
Step 3: Investigate High Load Average
Load average is often misunderstood.
Check it with:
uptime
You will see three values: 1-minute, 5-minute, and 15-minute load average.
A load average of 4.00 on a 4-core server may be acceptable. A load average of 4.00 on a 1-core server usually means processes are waiting. Linux load average includes runnable tasks and tasks blocked on disk I/O, so a high load does not always indicate high CPU usage. Brendan Gregg’s Linux performance material highlights this distinction in its explanation of load averages and CPU saturation.
Use this to separate CPU pressure from I/O pressure:
vmstat 1 10
In vmstat, check:
r: runnable processes waiting for CPU.b: processes blocked, often by I/O.siandso: swap in and swap out.wa: CPU time spent waiting on I/O.
The vmstat manual defines si as memory swapped in from disk and so as memory swapped to disk, which makes those columns useful when diagnosing memory pressure.
Step 4: Check Memory Properly
Do not panic just because Linux shows high used memory.
Run:
free -h
Focus on:
availableswap used- application memory usage
- OOM killer events
Check the largest memory consumers:
ps aux --sort=-%mem | head -20
Look for OOM killer messages:
dmesg -T | grep -i -E 'out of memory|oom|killed process'
If available memory is low and swap activity is increasing, the system may be memory constrained. If memory is mostly in buffer/cache and available remains healthy, that is usually normal Linux behavior.
Step 5: Understand Swappiness Before Changing It
vm.swappiness controls how aggressively the kernel swaps anonymous memory pages to disk. The kernel documentation describes the /proc/sys/vm tunables, including memory-management controls such as swappiness.
Check the current value:
sysctl vm.swappiness
To test a lower value temporarily:
sudo sysctl -w vm.swappiness=10
To make it persistent:
echo 'vm.swappiness=10' | sudo tee /etc/sysctl.d/99-swappiness.conf
sudo sysctl --system
Do not set swappiness to 0 everywhere by default. A very low value can reduce swapping for some database workloads, but it can also increase the likelihood that the OOM killer terminates processes under memory pressure. Red Hat’s performance-tuning guidance has historically recommended low swappiness values for certain database workloads, while also warning that overly aggressive avoidance of swapping can increase OOM risk.
Step 6: Check Disk I/O
Disk I/O problems are one of the most common causes of slow Linux systems.
Start with:
iostat -xz 1 10
Look at:
%utilawaitr/sandw/s- read/write throughput
- queue depth indicators
The iostat command monitors system input/output device loading by observing device activity and transfer rates. Its output helps you determine whether I/O load is balanced across disks or whether a single device is saturated.
Find processes generating I/O:
sudo iotop -o
Or use:
pidstat -d 1
Common disk bottlenecks include:
- Slow HDD-backed storage.
- Under-provisioned cloud volumes.
- Database queries doing too many reads.
- Log files growing too quickly.
- Backup jobs running during peak time.
- Containers writing heavily to overlay storage.
- Full filesystems.
- High inode usage.
Check space and inodes:
df -h
df -ih
Step 7: Review the I/O Scheduler
The Linux I/O scheduler controls how block I/O requests are ordered and dispatched. On modern systems, especially NVMe-backed servers, the best scheduler depends on the workload and storage type.
Check the current scheduler:
cat /sys/block/nvme0n1/queue/scheduler
Example output:
[mq-deadline] kyber bfq none
The scheduler in square brackets is active.
For fast NVMe storage, none may reduce CPU overhead. For other workloads, mq-deadline or bfq may perform better. Ubuntu’s kernel scheduler notes state that there is often little throughput difference between mq-deadline, none, and bfq on fast SSD or NVMe devices, and that none may be preferable in some fast multi-queue SSD configurations to reduce CPU overhead.
Test changes carefully:
echo none | sudo tee /sys/block/nvme0n1/queue/scheduler
Do not make I/O scheduler changes permanent until you have tested the workload before and after the change.
Step 8: Check Network Performance
For network issues, start with the basics:
ip -s link
ss -s
ss -tuna
Use sar for network statistics:
sar -n DEV 1 5
sar -n TCP,ETCP 1 5
The sar command can display live or historical system activity data, including CPU, memory, I/O, and network counters.
Look for:
- Packet drops.
- Interface errors.
- Retransmits.
- Connection backlog.
- DNS delays.
- Firewall or security group issues.
- Load balancer health check failures.
- Application connection pool exhaustion.
Avoid randomly increasing TCP buffers or backlog settings. Network tuning can help in specific high-throughput or high-connection environments, but it should be driven by clear evidence.
Useful checks:
# Show listening services
sudo ss -tulpn
# Show established TCP connections
ss -tan state established
# Check retransmits and TCP errors
netstat -s | grep -i retrans
If netstat is not installed, use ss from the iproute2 tooling instead.
Step 9: Check Pressure Stall Information
Modern Linux systems may expose Pressure Stall Information, known as PSI, under /proc/pressure.
Check it with:
cat /proc/pressure/cpu
cat /proc/pressure/memory
cat /proc/pressure/io
The Linux kernel documentation explains that PSI identifies and quantifies disruptions caused by pressure on CPU, memory, and I/O resources. This helps show how much productive time workloads lose while waiting on constrained resources.
This is especially useful on busy servers, container hosts, and Kubernetes nodes because basic CPU and memory usage percentages do not always show how much work is stalled.
Step 10: Keep Linux Updated
Keeping Linux updated improves security, stability, and sometimes performance. Kernel updates, driver updates, OpenSSL fixes, glibc fixes, filesystem fixes, and package updates can all matter.
For Ubuntu or Debian:
sudo apt update
sudo apt upgrade
For RHEL, Rocky Linux, AlmaLinux, or Fedora:
sudo dnf check-update
sudo dnf upgrade
On Ubuntu Server, automatic security updates are commonly handled with unattended-upgrades. Ubuntu’s documentation says unattended upgrades are enabled by default after installation for security updates, and that the configuration is controlled through files such as /etc/apt/apt.conf.d/20auto-upgrades.
Check Ubuntu unattended upgrades:
systemctl status unattended-upgrades
ls -l /var/log/unattended-upgrades/
For RHEL-based systems, use DNF Automatic:
sudo dnf install -y dnf-automatic
sudo systemctl enable --now dnf-automatic.timer
Red Hat documents DNF Automatic as the tool for checking, downloading, and applying updates automatically on a schedule.
For production systems, do not blindly auto-reboot critical servers. Use maintenance windows, health checks, monitoring, and rollback plans.
Step 11: Remove Unnecessary Software
A leaner system is easier to secure, patch, and troubleshoot.
List installed packages:
# Debian / Ubuntu
apt list --installed
# RHEL / Rocky / Alma / Fedora
dnf list installed
Remove packages you clearly do not need:
# Debian / Ubuntu
sudo apt autoremove
# RHEL / Rocky / Alma / Fedora
sudo dnf autoremove
Be careful on servers. Removing the wrong package can remove dependencies or break a service. Always review the package manager’s proposed changes before confirming.
For new deployments, start with a minimal installation and add only what you need. This reduces background services, attack surface, and maintenance overhead.
Step 12: Disable Unnecessary Services
System startup services can affect boot time, resource usage, and security posture.
List enabled services:
systemctl list-unit-files --type=service --state=enabled
Check running services:
systemctl --type=service --state=running
Disable a service from starting at boot:
sudo systemctl disable service-name
Stop it immediately as well:
sudo systemctl disable --now service-name
Red Hat’s systemd documentation explains that systemctl is used to view, start, stop, restart, enable, and disable services.
Avoid using /etc/init.d or /etc/rc.local as your default startup method on modern Linux distributions. Use native systemd unit files and timers unless you are maintaining an older system.
Step 13: Use systemd Timers Instead of Cron for Service Jobs
Cron still works, but systemd timers are usually better for system-level jobs because they integrate with service management, logging, dependencies, and failure handling.
Example service:
# /etc/systemd/system/example-job.service
[Unit]
Description=Example maintenance job
[Service]
Type=oneshot
ExecStart=/usr/local/bin/example-job.sh
Example timer:
# /etc/systemd/system/example-job.timer
[Unit]
Description=Run example maintenance job daily
[Timer]
OnCalendar=daily
Persistent=true
[Install]
WantedBy=timers.target
Enable it:
sudo systemctl daemon-reload
sudo systemctl enable --now example-job.timer
systemctl list-timers
Use cron for simple user-level scheduling. Use systemd timers for production service jobs where logging, dependencies, and operational consistency matter.
Step 14: Profile High CPU With perf
When top shows high CPU but you do not know why, use perf.
Install the correct package for your distribution, then run:
sudo perf top
For a short recording:
sudo perf record -g -- sleep 30
sudo perf report
The Linux perf tool can use hardware counters, software counters, tracepoints, kprobes, and uprobes for performance analysis. The perf wiki describes it as a powerful profiler capable of lightweight profiling, and the man page describes it as a framework for hardware and software performance analysis.
Use perf when you need to understand where CPU time is actually going, especially for application-level bottlenecks, kernel overhead, or unexpected hot paths.
Step 15: Use TuneD on RHEL-Based Systems
On RHEL, Rocky Linux, AlmaLinux, and similar systems, TuneD can apply performance profiles for different workloads.
Install and enable it:
sudo dnf install -y tuned
sudo systemctl enable --now tuned
List profiles:
tuned-adm list
Show the active profile:
tuned-adm active
Apply a profile:
sudo tuned-adm profile throughput-performance
Red Hat documents TuneD as a supported way to manage performance profiles, including profiles for throughput, latency, power usage, and workload-specific tuning.
Do not apply a TuneD profile blindly. Test it against your workload and confirm the result.
Step 16: Optimize Desktop Environments Carefully
For desktop Linux, the desktop environment can affect responsiveness, especially on older hardware.
If performance is poor on a workstation or laptop, consider:
- Disabling unnecessary startup applications.
- Reducing visual effects.
- Switching from GNOME or KDE Plasma to XFCE, LXQt, or another lighter desktop.
- Checking browser memory usage.
- Checking GPU driver issues.
- Ensuring the system is not swapping heavily.
On servers, desktop environment tuning is usually irrelevant, as a production Linux server should not normally run a full GUI unless there is a specific reason.
Step 17: Optimize Containers and Virtual Machines
If the Linux system runs containers or virtual machines, check resource limits and host-level metrics.
For Docker:
docker stats
docker system df
For systemd-cgroup visibility:
systemd-cgtop
For Kubernetes nodes:
kubectl top nodes
kubectl top pods -A
Container performance issues are often caused by:
- CPU limits that are too low.
- Memory limits causing OOM kills.
- Heavy logging.
- Slow overlay filesystem writes.
- Noisy neighbors on the same host.
- Under-sized nodes.
- Poor application connection pooling.
If a container is slow, check both the container and the host. A container may look constrained because the host is under pressure.
Step 18: Review Logs
Performance issues often show up in logs before they show up in graphs.
Check the current boot logs:
journalctl -b -p warning
Check a specific service:
journalctl -u nginx --since "1 hour ago"
Follow logs live:
journalctl -f
Look for:
- OOM kills.
- Disk errors.
- Filesystem remounts.
- Service restart loops.
- Failed health checks.
- DNS failures.
- Authentication delays.
- Application timeouts.
- Database connection errors.
Do not focus only on system-level tools. Sometimes Linux is fine, and the application is the bottleneck.
Step 19: Make One Change at a Time
This is where many performance tuning attempts go wrong.
Do not change swappiness, network buffers, I/O scheduler, service limits, application workers, package versions, and database settings all at once. If performance improves or gets worse, you will not know which change caused it.
Use this workflow:
- Capture baseline metrics.
- Make one change.
- Restart only what is needed.
- Run the same workload again.
- Compare before and after.
- Keep the change only if it helped.
- Record what you changed and why.
Example baseline capture:
date
uptime
free -h
vmstat 1 10
iostat -xz 1 10
sar -u 1 5
Save the output before and after your change.
Verification
After making a change, verify that it improved the real symptom.
Use:
uptime
free -h
vmstat 1 10
iostat -xz 1 10
sar -u 1 5
systemctl --failed
Then check the user-facing metric:
- Web response time.
- API latency.
- Database query time.
- Batch job duration.
- Throughput.
- Error rate.
- Queue depth.
- CPU throttling.
- Disk latency.
- Memory pressure.
A system is not “optimized” because a command output looks better. It is optimized when the workload performs better and remains stable.
Troubleshooting Common Linux Performance Problems
High CPU Usage
Use:
top
pidstat -u 1
mpstat -P ALL 1
sudo perf top
Likely causes:
- Busy application process.
- Infinite loop.
- Too many workers.
- Expensive queries.
- Compression or encryption workload.
- Kernel overhead.
- Container CPU limits.
High Load but Low CPU
Use:
vmstat 1
iostat -xz 1
Likely causes:
- Disk I/O wait.
- Blocked processes.
- Slow network storage.
- Database stalls.
- Backup or log rotation jobs.
Memory Looks Full
Use:
free -h
ps aux --sort=-%mem | head
Check available, not just used. Linux uses memory for cache by design.
Swap Usage Is Increasing
Use:
vmstat 1
swapon --show
Likely causes:
- Not enough RAM.
- Memory leak.
- Over-sized application workers.
- Containers without sane limits.
- Too many services on one host.
Disk Is Slow
Use:
iostat -xz 1
sudo iotop -o
pidstat -d 1
Likely causes:
- Saturated disk.
- Under-provisioned cloud volume.
- Large log writes.
- Backup jobs.
- Database reads.
- Full filesystem.
- Slow network storage.
Network Is Slow
Use:
ip -s link
ss -s
sar -n DEV 1 5
sar -n TCP,ETCP 1 5
Likely causes:
- Packet drops.
- Retransmits.
- DNS delays.
- Firewall issues.
- Saturated interface.
- Load balancer problems.
- Application connection limits.
Final Thoughts
Linux performance optimization is a process, not a list of magic commands.
Start with the symptom. Measure the system. Identify the bottleneck. Make one controlled change. Measure again. Keep the change only if it improves the workload.
Most Linux systems do not need aggressive kernel tuning. They need clean updates, sensible services, sufficient CPU and memory, healthy storage, working network paths, and applications that do not conflict with the operating system.
The best Linux tuning is boring: good baselines, careful changes, clear rollback, and evidence that the system is genuinely faster after the work.
Related Linux Guides
If you are tuning a Linux server, these guides are good next steps:
- Start with the Linux Start Here guide if you want a broader overview of Linux content.
- Use the Ubuntu Server First 30 Minutes checklist when building or reviewing a new Ubuntu server.
- Check disk space in Linux if your optimization problem is really a full filesystem.
Leave a Reply