
DevOps pain is universal. Pipelines that take 20 minutes to tell you nothing, containers that refuse to start in production but run fine on your laptop, CI failures you can’t reproduce locally — I’ve been there more times than I care to count. The good news: most of this pain is preventable with the right habits and a handful of targeted tricks.
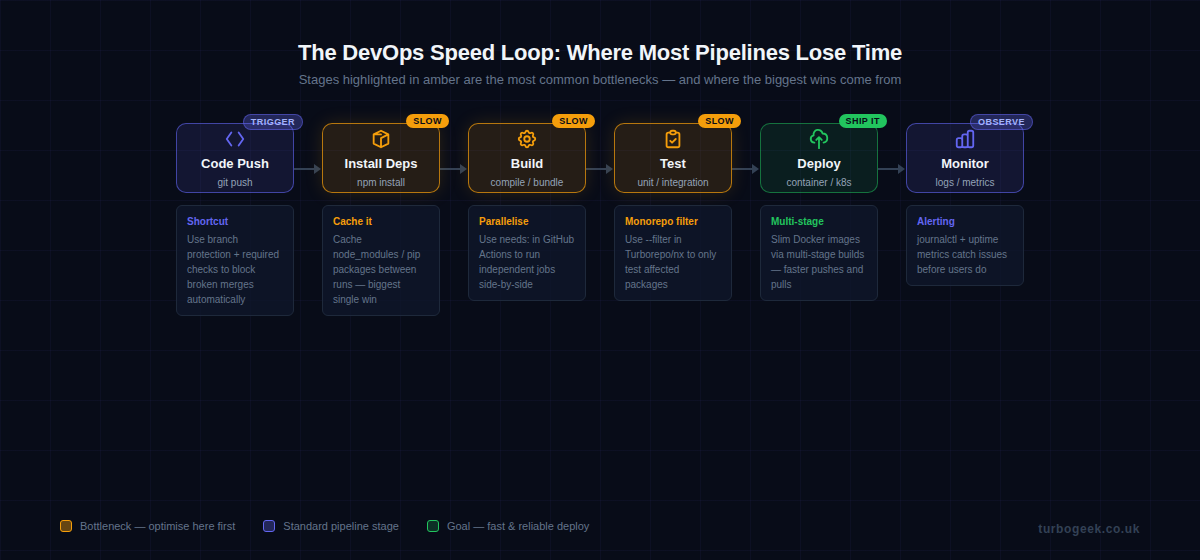
I’ve shipped pipelines across startups and scale-ups, and the same bottlenecks show up every time. This post collects the 15 hacks that have saved me the most time and the most 2am incident calls.
TL;DR
- Pipeline Speed: Parallelise jobs, cache dependencies, use monorepo filters, and fail fast — shave minutes off every run.
- Debugging at Scale: Live log tailing, kubectl previous-pod logs, GitHub Actions debug mode, and strict shell flags expose failures fast.
- Container Tricks: Multi-stage builds, .dockerignore, pruning disk, and platform flags stop image bloat and arch mismatch headaches.
- Git and CI Shortcuts: git bisect, local Actions testing with gh act, and branch protection rules keep broken code out of main.
- Monitoring Hacks: systemctl, journalctl, and uptime metrics let you catch problems before your users do.
| Hack | What it does | Tool / Command |
|---|---|---|
| Parallelise jobs | Run independent jobs simultaneously | needs: in GitHub Actions |
| Cache dependencies | Skip reinstalling on every run | actions/cache, Docker layer cache |
| Monorepo filter | Only build/test affected packages | Turborepo --filter, nx affected |
| Fail fast | Stop matrix early on first failure | fail-fast: true |
| Live log tailing | Stream container output in real time | docker logs --tail 50 -f |
| Crashed pod logs | See why a Kubernetes pod died | kubectl logs --previous |
| Actions debug mode | Verbose CI runner output | ACTIONS_RUNNER_DEBUG=true |
| Strict shell flags | Surface hidden script failures | set -euxo pipefail |
| Multi-stage Docker | Shrink final image size | Dockerfile multi-stage |
| .dockerignore | Keep build context lean | .dockerignore file |
| Prune CI disk | Reclaim space between runs | docker system prune -a |
| Platform flag | Fix M1 Mac arch mismatches | --platform linux/amd64 |
| git bisect | Binary-search for the breaking commit | git bisect start/good/bad |
| Local CI testing | Test workflows before pushing | gh act |
| Branch protection | Block broken merges automatically | GitHub branch rules |
New to DevOps pipelines? Start with Pipeline Speed Hacks — the quickest wins are there.
Pipeline Speed Hacks: Parallelise, Cache, and Trim the Fat
The fastest pipeline is one where work happens simultaneously and never repeats itself. Most default CI configs are sequential and stateless — two things you can fix in an afternoon.
1. Parallelise jobs with needs:
By default, GitHub Actions jobs run sequentially unless you tell them otherwise. The needs: key defines dependency relationships — any job without a needs: declaration runs in parallel. Here’s a pattern I use on every project:
name: CI

on: [push]

jobs:
  lint:
    runs-on: ubuntu-latest
    steps:
      - uses: actions/checkout@v4
      - run: npm ci && npm run lint

  test:
    runs-on: ubuntu-latest
    steps:
      - uses: actions/checkout@v4
      - uses: actions/cache@v4
        with:
          path: ~/.npm
          key: ${{ runner.os }}-node-${{ hashFiles('**/package-lock.json') }}
      - run: npm ci && npm test

  build:
    runs-on: ubuntu-latest
    needs: [lint, test]   # only runs if both pass
    steps:
      - uses: actions/checkout@v4
      - run: npm ci && npm run build

  deploy:
    runs-on: ubuntu-latest
    needs: build
    if: github.ref == 'refs/heads/main'
    steps:
- run: echo "Deploy here"In this setup, lint and test run simultaneously. Build only kicks off once both pass. On a project with a 6-minute test suite, I’ve seen end-to-end pipeline time drop from 14 minutes to 8 just by restructuring job dependencies.
2. Cache dependencies between runs
The actions/cache step in the YAML above is doing a lot of work. Caching ~/.npm means npm doesn’t hit the network on every push. The same pattern applies to pip’s cache (~/.cache/pip), Go modules (~/go/pkg/mod), and Docker layer caches. A cold install that takes 90 seconds becomes a 4-second cache restore.
3. Monorepo filtering with Turborepo or nx
If you’re working in a monorepo, running all tests on every push is wasteful. Both Turborepo and nx can identify which packages were affected by a change and only run pipelines for those. The --filter flag in Turborepo does the heavy lifting:
# Only build packages affected by changes vs main
npx turbo run build --filter='[origin/main]'

# nx equivalent
npx nx affected --target=test --base=origin/main4. Fail fast in matrix builds
Matrix builds that test across Node versions, Python versions, or operating systems will keep running all combinations even after one fails — unless you add fail-fast: true. Add it. There is no point burning CI minutes on a 3×3 matrix if the first combination already blew up.
Debugging at Scale: Finding Failures Fast
When something breaks in production or CI, the clock is ticking. The difference between a 5-minute fix and a 90-minute incident often comes down to whether you know which commands to run first.
5. Live log tailing with Docker
The most common mistake I see when debugging containers is running docker logs container_name and getting a wall of historical output. Use --tail and -f together to see only recent entries and stream new ones:
# Tail last 50 lines and follow live output
docker logs --tail 50 -f container_name

# Exec into a running container for interactive debugging
docker exec -it container_name /bin/sh

# Check container resource usage
docker stats container_name --no-stream

# Inspect environment variables (useful for misconfigured containers)
docker inspect container_name | python3 -c "
import sys, json
envs = json.load(sys.stdin)[0]['Config']['Env']
for e in envs: print(e)
"6. Kubernetes: describe + previous logs
When a Kubernetes pod crashes and restarts, the logs from the dead container are gone — unless you ask for them explicitly. kubectl describe pod gives you events and resource status. kubectl logs --previous retrieves logs from the last terminated container. Run both, in that order.
7. GitHub Actions debug mode
When a GitHub Actions workflow fails with a cryptic non-zero exit code and no useful output, enable debug mode by adding a secret named ACTIONS_RUNNER_DEBUG with the value true. The runner will dump step inputs, outputs, and full command traces. It’s verbose, but it’s usually the fastest path to root cause. You don’t need to change any YAML — just the secret.
8. set -euxo pipefail in shell scripts
Shell scripts in CI are silent killers. By default, a script will happily continue after a command fails and return exit code 0 from the last command — even if everything above it blew up. This one-liner at the top of every shell script surfaces hidden failures immediately:
#!/usr/bin/env bash
set -euxo pipefail
# -e  exit immediately on error
# -u  treat unset variables as errors
# -x  print each command before executing (great for CI logs)
# -o pipefail  catch failures in piped commands

# Everything below this line runs in strict mode
echo "Running deployment..."
npm run build
npm run deployThe -x flag is especially useful in CI because it prints every command before executing it, turning cryptic logs into a readable step-by-step trace.
Container Tricks That Actually Save Time
Containers are the foundation of modern DevOps, but they come with footguns. These four tricks have saved me hours of head-scratching.
9. Multi-stage Docker builds
A production image doesn’t need your build tools, test frameworks, or development dependencies. Multi-stage builds let you compile in one image and copy only the output into a lean runtime image. Here’s a Node.js example that cuts image size from ~800 MB to under 120 MB:
# Stage 1: Build
FROM node:20-alpine AS builder
WORKDIR /app
COPY package*.json ./
RUN npm ci
COPY . .
RUN npm run build

# Stage 2: Production runtime
FROM node:20-alpine AS runner
WORKDIR /app
ENV NODE_ENV=production

# Only copy what we need
COPY --from=builder /app/dist ./dist
COPY --from=builder /app/node_modules ./node_modules
COPY package*.json ./

EXPOSE 3000
CMD ["node", "dist/index.js"]10. .dockerignore — don’t copy node_modules into the build context
The Docker build context is everything sent to the Docker daemon before a build starts. If your project has a node_modules directory with 50,000 files, every docker build spends seconds transferring them — even if the Dockerfile never uses them. A .dockerignore file works exactly like .gitignore:
node_modules
.git
.env
*.log
dist
.DS_Store
coverage
.nyc_output11. docker system prune -a to reclaim CI disk
CI runners accumulate dangling images, stopped containers, and unused volumes. On a shared runner or a self-hosted one, this fills up the disk fast. Add a prune step to your pipeline or run it as a scheduled job on your runner host. Use -a to remove all unused images, not just dangling ones.
12. –platform linux/amd64 to fix M1 arch mismatches
If you develop on an Apple Silicon Mac (M1/M2/M3), you’ll build arm64 images by default. Most CI runners and production servers are amd64. The result: an image that works on your machine but crashes on the server. Force the target platform explicitly during development and CI builds: docker build --platform linux/amd64 .
If you’re setting up a fresh Ubuntu machine for DevOps work, check out Ubuntu for Developers — it covers the base setup that makes everything here easier, including Docker installation, Git configuration, and the tooling you’ll need day-to-day.
Git and CI Workflow Shortcuts
Good Git and CI hygiene prevents entire categories of incidents. These three shortcuts have saved me more time than any other tools in this list.
13. git bisect to find the breaking commit
git bisect performs a binary search through your commit history to find the exact commit that introduced a bug. You tell it one good commit and one bad commit, and it checks out the midpoint. You test, tell it good or bad, and it narrows down until it pinpoints the culprit. For a history of 1,000 commits, it only takes 10 steps:
# Start bisect
git bisect start

# Mark the current commit as bad (bug is present)
git bisect bad

# Mark a known-good commit (e.g. last week's release tag)
git bisect good v2.3.1

# Git checks out a commit halfway through — run your test
npm test

# Tell git the result
git bisect good   # or: git bisect bad

# Repeat until git reports: "abc1234 is the first bad commit"

# Reset when done
git bisect resetYou can even automate the test step with git bisect run npm test and let bisect find the bad commit without manual intervention.
14. gh act — test GitHub Actions locally
Pushing a commit just to test a workflow change is slow and pollutes your commit history. The act tool (installable via the GitHub CLI extension) runs your GitHub Actions workflows locally using Docker. You catch YAML syntax errors, missing secrets, and logic bugs before they hit CI:
# Install act via GitHub CLI
gh extension install nektos/gh-act

# Run the default push event workflow
gh act push

# Run a specific job
gh act push --job build

# Pass secrets from a local file
gh act push --secret-file .env.act15. Branch protection + required status checks
This is the single most impactful process change you can make on a team. Set up branch protection rules on main that require your CI status checks to pass before a PR can be merged. No more “it works on my branch” merges that break the build for everyone. Configure it under Settings → Branches → Branch protection rules in GitHub.
Monitoring Hacks: See Problems Before Your Users Do
Shipping fast is only half the job. Knowing when something goes wrong — before your users file a ticket — is the other half. These tools are built into Linux and cost nothing to use.
systemctl and journalctl — your first two commands after a deploy
After every deployment, I run two commands. systemctl status my-service tells me instantly whether the service is running, how long it’s been up, and whether it’s in a crash loop. journalctl gives me the logs:
# Check service status
systemctl status my-service

# Stream logs from the last hour
journalctl -u my-service --since "1 hour ago" -f

# See only errors and critical messages
journalctl -u my-service -p err --since "1 hour ago"

# Check overall system uptime and load
uptime

# Quick memory and swap overview
free -hThe --since "1 hour ago" flag is underused. Combined with -f to follow live output, it turns a vague “something’s wrong” alert into a specific error message in seconds. Pair these with an uptime monitoring tool (UptimeRobot is free for 50 monitors) and you’ll know about downtime before your users do.
FAQ
What are the most common DevOps pipeline bottlenecks?
The three biggest time sinks in most pipelines are: installing dependencies on every run (fix with caching), running all jobs sequentially when they could run in parallel (fix with needs: in GitHub Actions), and running the full test suite on changes that only affect one package in a monorepo (fix with Turborepo or nx filtering). Tackle these three and you’ll typically cut pipeline time by 50–70%.
How do I debug a Docker container that won’t start?
Start with docker logs container_name to see the crash output. If the container exits too fast to catch logs, use docker run --entrypoint /bin/sh image_name to start it interactively and bypass the default command. Check docker inspect container_name for environment variables and port bindings, and verify the image was built for the right platform with docker image inspect image_name | grep Architecture.
What is the fastest way to speed up a CI/CD pipeline?
Add a dependency cache first — it’s the single change with the highest return on effort. Caching node_modules, pip packages, or Go modules between runs typically saves 60–120 seconds per run with one actions/cache step. After that, look at parallelizing your jobs. If your lint, test, and type-check jobs run sequentially, restructure them to run in parallel using needs:. Those two changes alone will cut most pipelines by 40–60%.
Ready to take this further? The next post in this series covers automating your entire DevOps workflow with AI-assisted scripts — from auto-generating CI configs to scripted incident response playbooks.